Deriving a source spectrum
What you will learn
You will learn how to use the csspec script to derive the spectral energy distribution (SED) of a gamma-ray source.
You may also be interested in the determination of the spectral energy distribution (SED) of the Crab nebula that is independent of an assumed spectral shape. This can be achieved by the csspec script.
The csspec script divides the energy range into a number of indepedent energy bins and performs in each of the energy bins a maximum likelihood fit of the source model. Since the spectral shape is generally poorly constrained within a narrow energy bin, all spectral parameters except of the scaling factor of the source model will be fixed for the fitting. The fit results will be converted into a flux value per energy bin. The script also determines upper flux limits as well as the Test Statistic value of the source in each of the bins.
Below an example how of you can determine the SED of the Crab for 10 energy bins between 100 GeV and 100 TeV:
$ csspec
Input event list, counts cube, or observation definition XML file [events.fits] cntcube.fits
Input exposure cube file [NONE] expcube.fits
Input PSF cube file [NONE] psfcube.fits
Input background cube file [NONE] bkgcube.fits
Input model definition XML file [$CTOOLS/share/models/crab.xml] crab_results.xml
Source name [Crab]
Spectrum generation method (SLICE|NODES|AUTO) [AUTO]
Binning algorithm (FILE|LIN|LOG|POW) [LOG]
Lower energy limit (TeV) [0.1]
Upper energy limit (TeV) [100.0]
Number of energy bins [20] 10
Output spectrum file [spectrum.fits]
There are different methods to create a binned spectrum:
- SLICE splits the dataset in independent energy slices, and performs an independent fit in each of them
- NODES performs an overall fit where the source of interest is modeled spectrally using a node function, whit a free parameter for the flux in each energy bin
- AUTO is SLICE for CTA and NODES for other instruments.
The csspec script creates the FITS file spectrum.fits that contains
the results of the SED fitting. A graphical display of the fit results is
shown below.
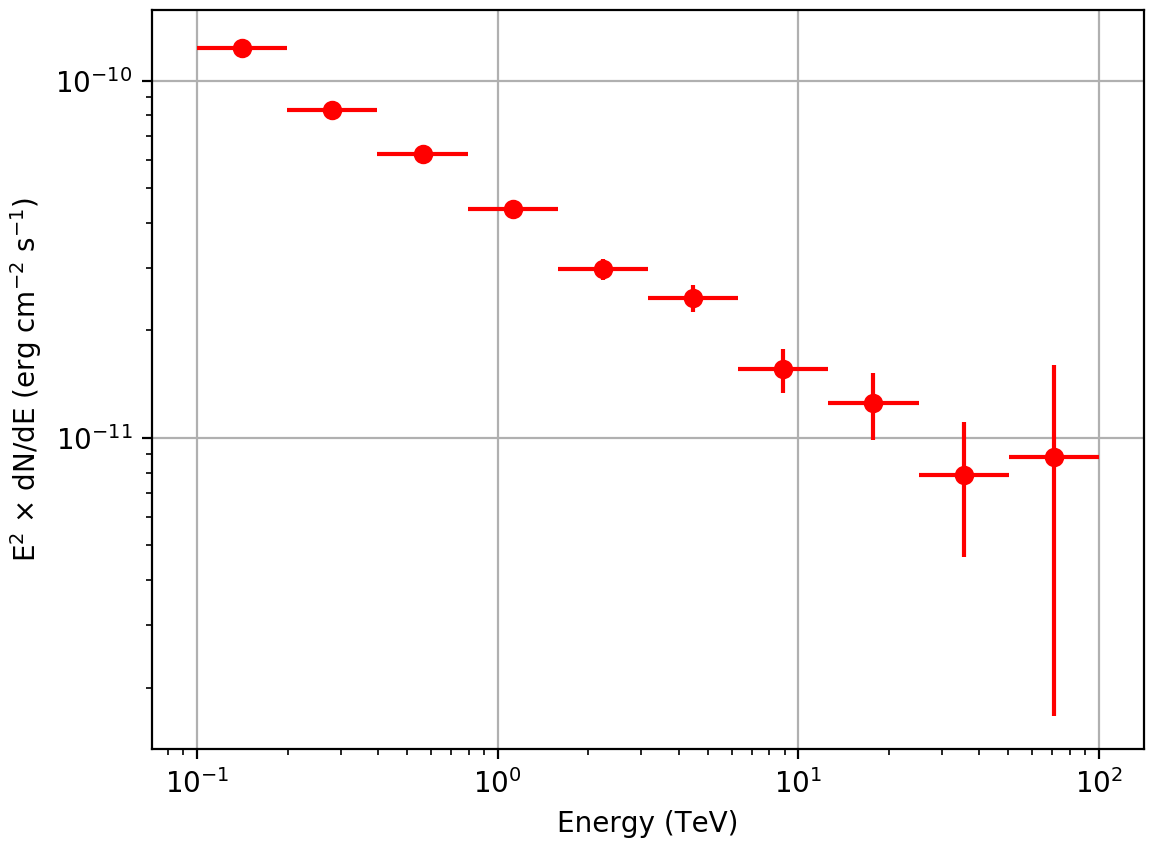
Spectral energy distribution of the Crab nebula
Note
The figure was created by typing:
$ $CTOOLS/share/examples/python/show_spectrum.py spectrum.fits