Generating a butterfly diagram of the source spectrum
What you will learn
You will learn how to use the ctbutterfly tool to generate a butterfly diagram for the source spectrum.
The ctlike tool returns the statistic uncertainties for all fitted parameters of the spectral model, but you may be interested in the manifold of spectral models that are statistically compatible with the data. For this purpose you should generate a butterfly diagram. You do this using the ctbutterfly tool as follows:
$ ctbutterfly
Input event list, counts cube or observation definition XML file [events.fits] cntcube.fits
Input exposure cube file [NONE] expcube.fits
Input PSF cube file [NONE] psfcube.fits
Input background cube file [NONE] bkgcube.fits
Source of interest [Crab]
Input model definition XML file [$CTOOLS/share/models/crab.xml] crab_results.xml
Lower energy limit (TeV) [0.1]
Upper energy limit (TeV) [100.0]
Output ASCII file [butterfly.txt]
The ctbutterfly tool creates an ASCII file butterfly.txt that
contains for each energy in MeV (column 1) the best fitted intensity
(column 2), the minimum intensity (column 3) and the maximum intensity
(column 4) that is compatible with the data, all in units of
\({\rm photons} \, {\rm cm}^{-2} \, {\rm s}^{-1} \, {\rm MeV}^{-1}\).
The number of energies is given by the hidden enumbins parameter which by
default is set to 100. Below an excerpt of the first lines of the
butterfly.txt file:
103514.216667934 8.17999288138647e-15 7.96480369463198e-15 8.39518206814095e-15
110917.48152624 6.88846691601701e-15 6.71266078582656e-15 7.06427304620745e-15
118850.222743702 5.80085791529665e-15 5.65725791756428e-15 5.94445791302902e-15
127350.308101666 4.88496975650954e-15 4.76769161306379e-15 5.00224789995529e-15
...
A graphical display of the results is shown below:
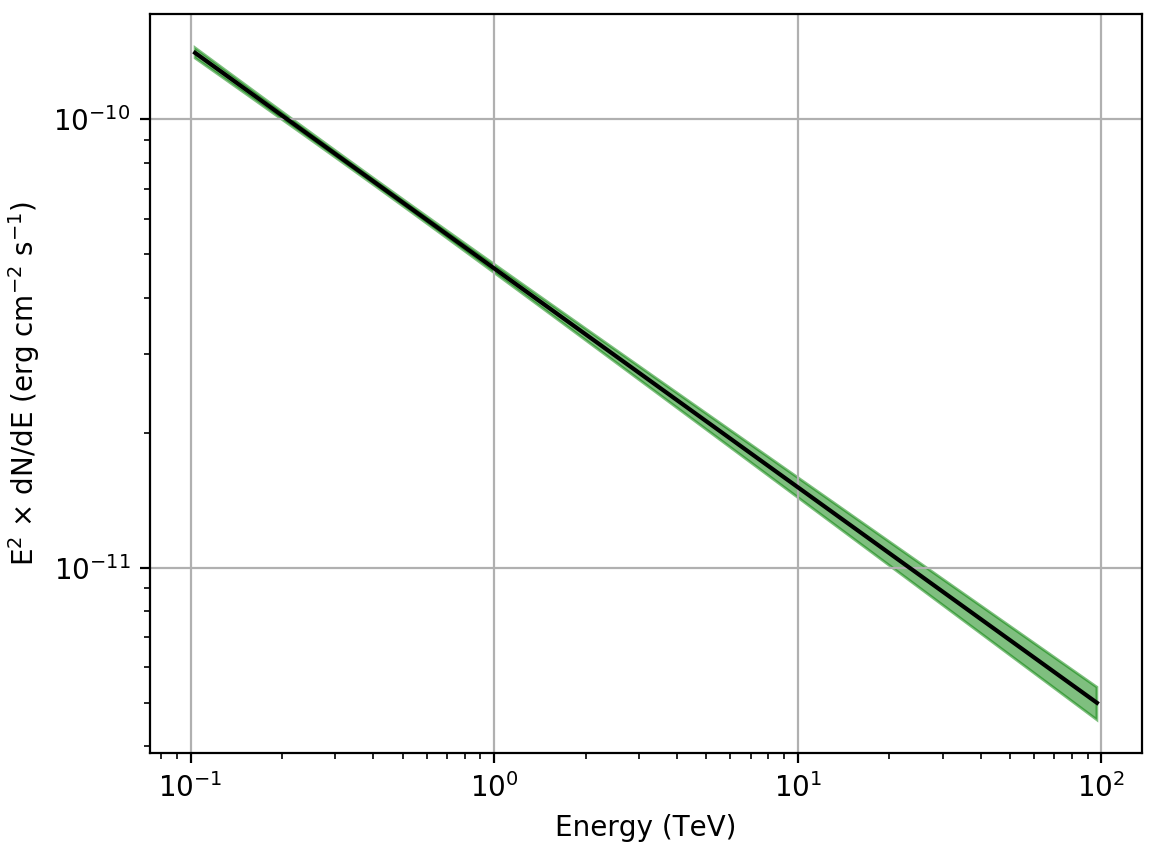
Butterfly diagram of the Crab nebula
Note
The ctools package does not contain any tools or scripts for graphical display of results since results are generally written into standard FITS files that are readily displayed by existing astronomical tools.
Nevertheless, for your convenience several scripts for graphical display
are included in the ctools package that rely on the
matplotlib
Python module. You can find these scripts in the
$CTOOLS/share/examples/python folder.
Read How to display the results? to learn more about the available scripts. The plot above was generated using:
$ $CTOOLS/share/examples/python/show_butterfly.py butterfly.txt