How to use Virtual Observatory tools with ctools?
Several ctools can interact with Virtual Observatory tools such as Aladin or Topcat for the visualisation and exploration of the analysis results.
Let’s take the example of generating a sky map, as explained before. Start with launching the Aladin application on your desktop:
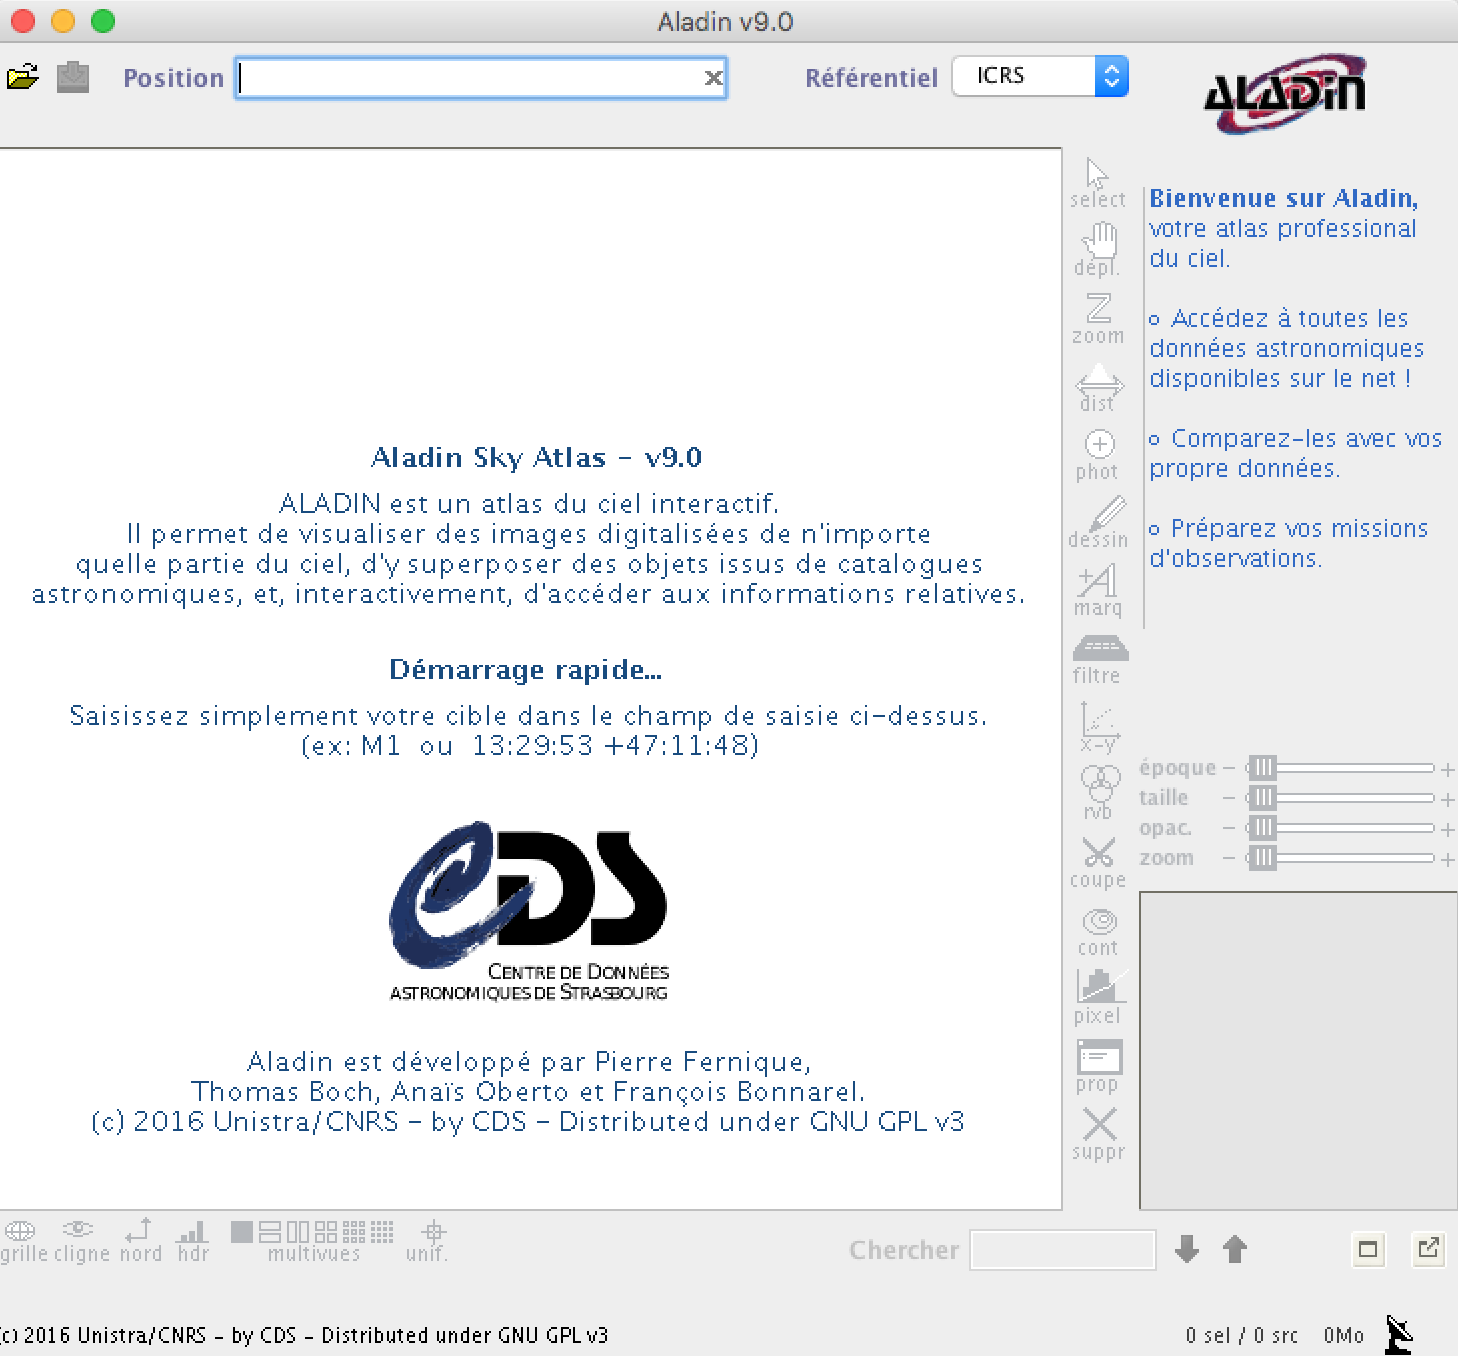
Aladin application after start-up
Then use ctskymap to create a sky map and specify publish=yes
as argument after the tool name:
$ ctskymap publish=yes
Input event list or observation definition XML file [events.fits] obs_selected.xml
Coordinate system (CEL - celestial, GAL - galactic) (CEL|GAL) [CEL] GAL
Projection method (AIT|AZP|CAR|GLS|MER|MOL|SFL|SIN|STG|TAN) [CAR]
First coordinate of image center in degrees (RA or galactic l) (0-360) [83.63] 0.0
Second coordinate of image center in degrees (DEC or galactic b) (-90-90) [22.01] 0.0
Image scale (in degrees/pixel) [0.02]
Size of the X axis in pixels [200] 400
Size of the Y axis in pixels [200] 400
Lower energy limit (TeV) [0.1]
Upper energy limit (TeV) [100.0]
Background subtraction method (NONE|IRF|RING) [NONE]
Output skymap file [skymap.fits]
Once ctskymap has terminated, the resulting sky map will automatically appear in the Aladin application (see below).
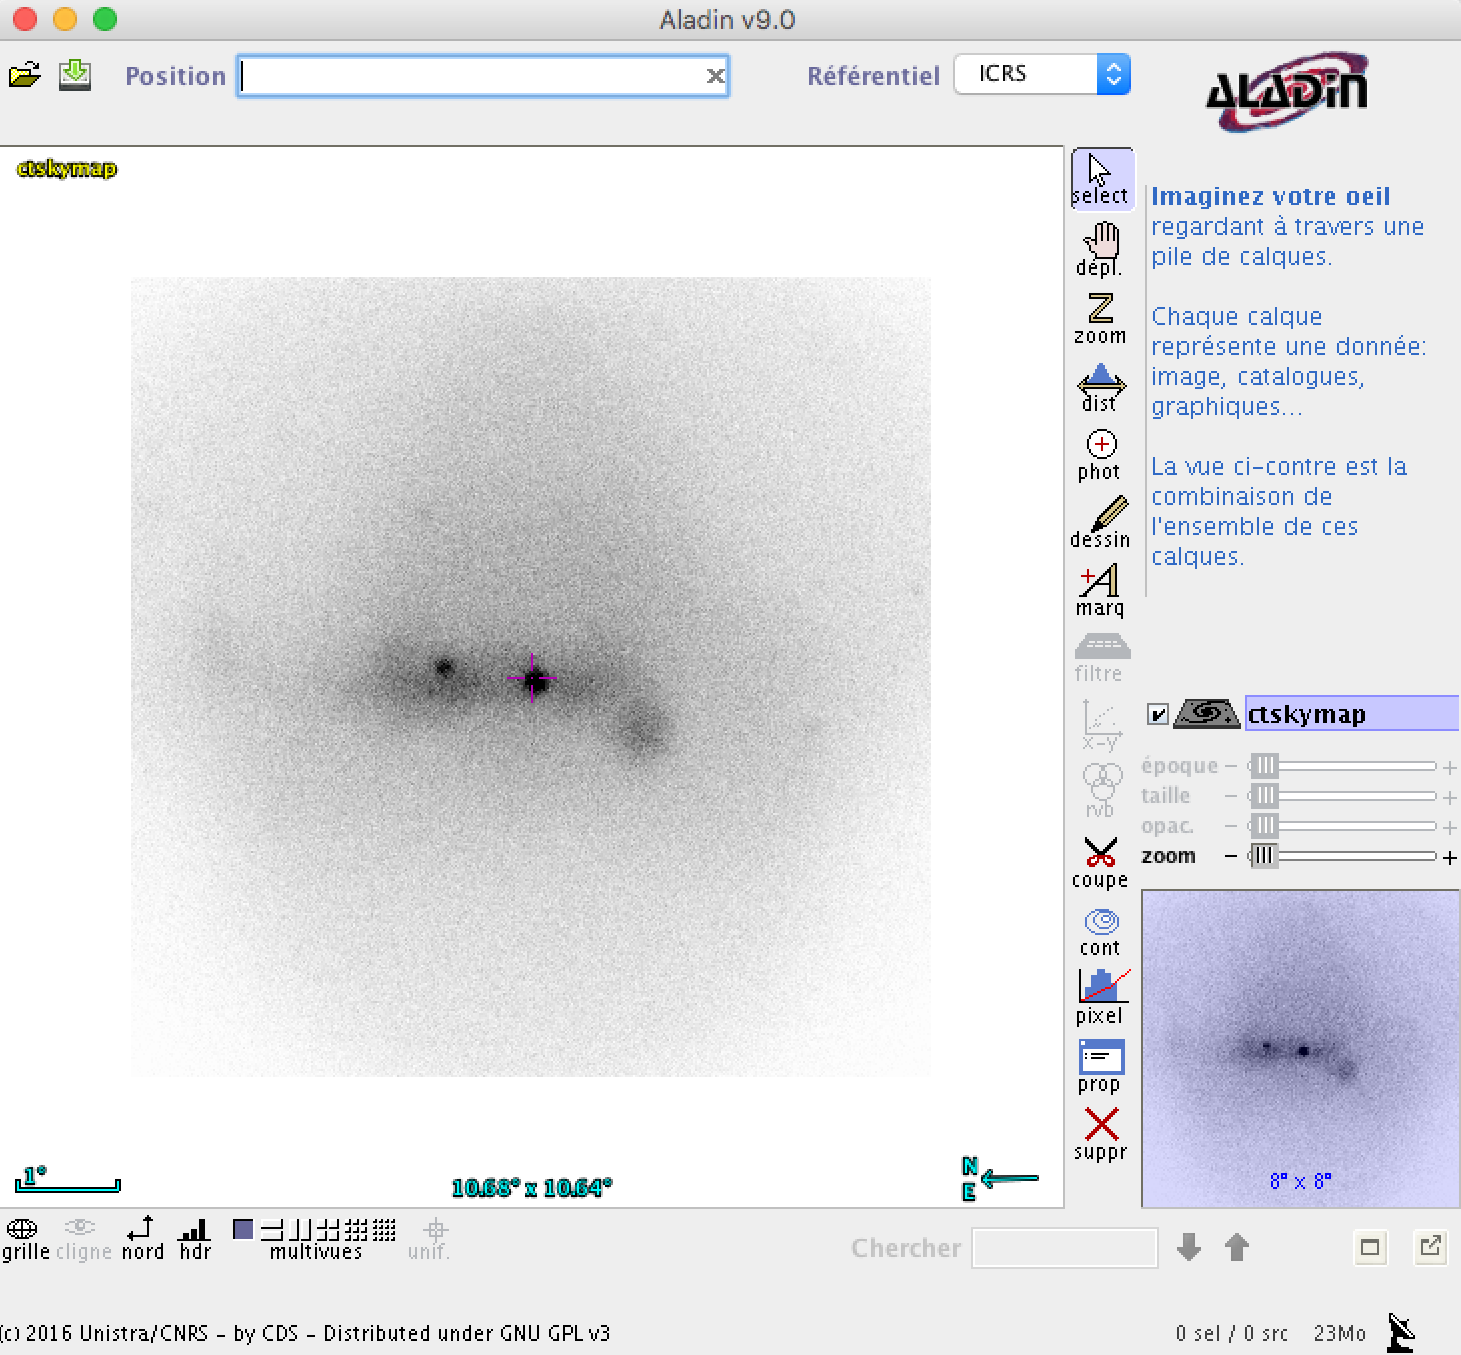
Aladin application after ctskymap finished execution
You can then overlay sky maps obtained at other wavelengths for comparison or
objects extracted from a catalogue. In the example below we show the overlay
of the
Fermi/LAT 3FGL catalogue
catalogue which allows us to identify Src001 with a Fermi/LAT source at
the Galactic centre.
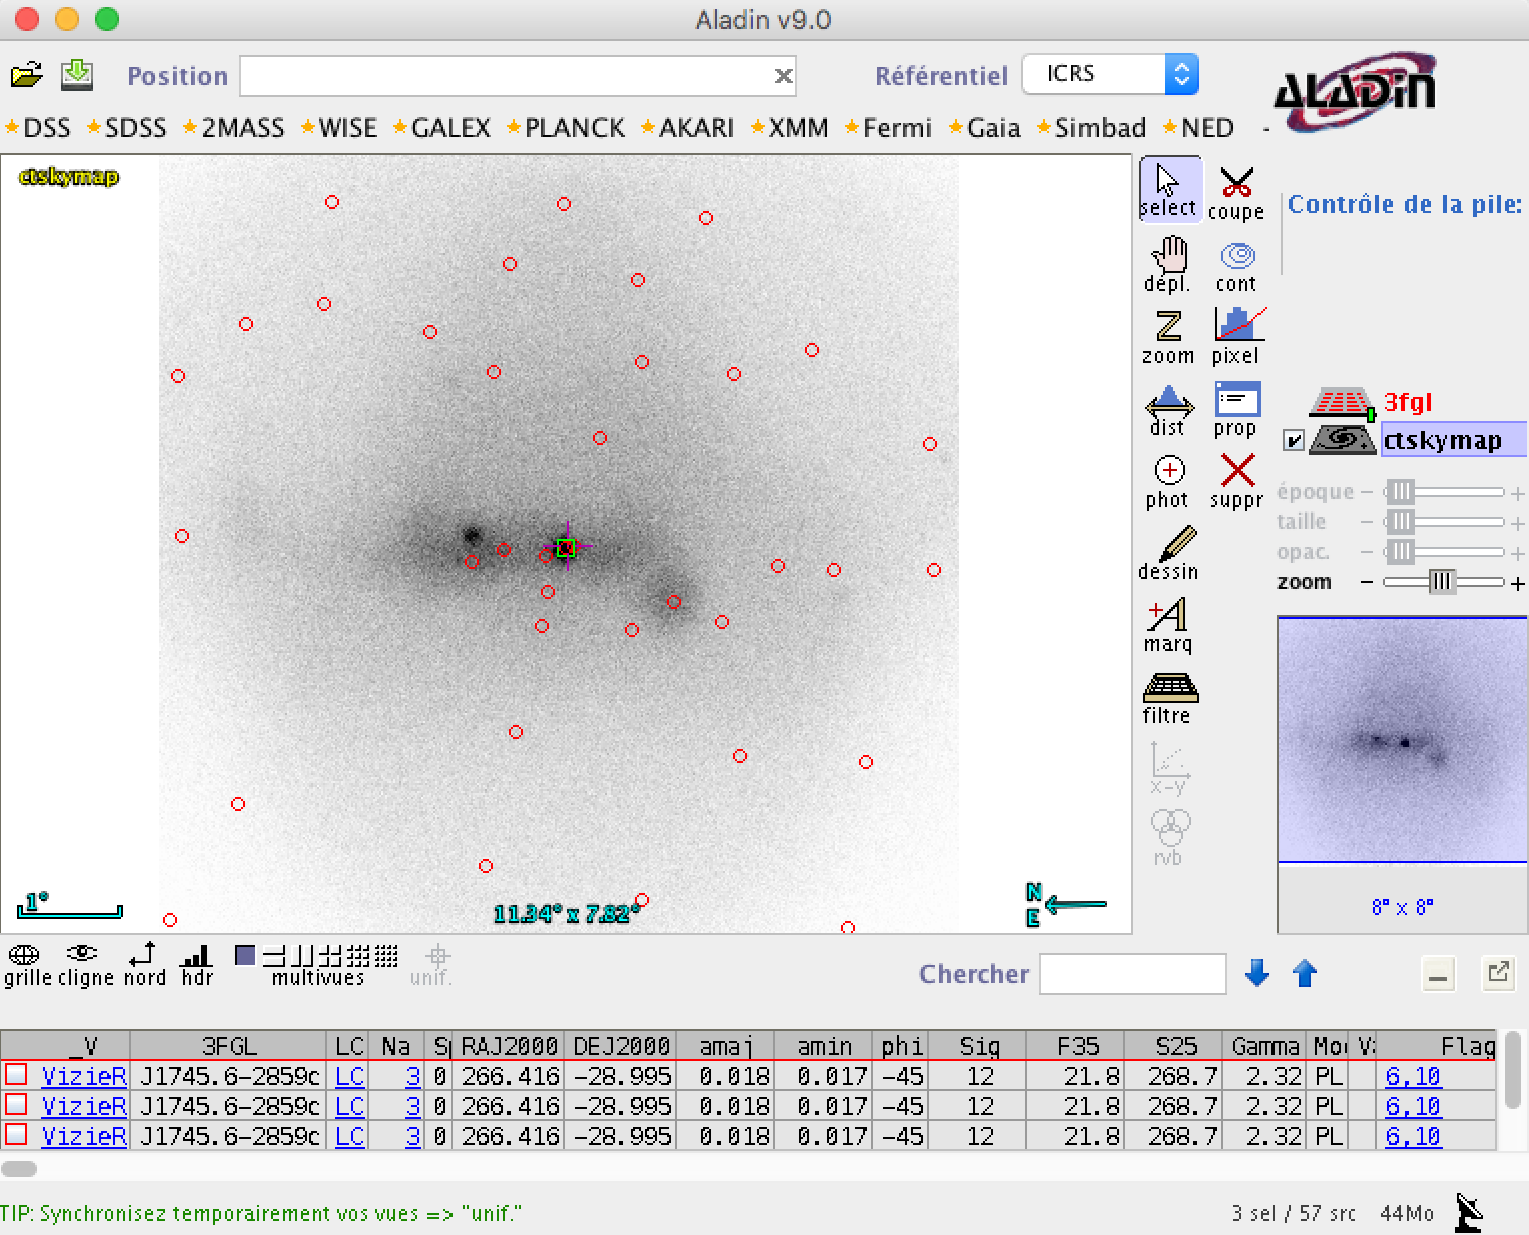
Overlay of the Fermi/LAT 3FGL catalogue over the sky map
Another example is the display of an event list using Topcat. Start with launching the Topcat application on your desktop:
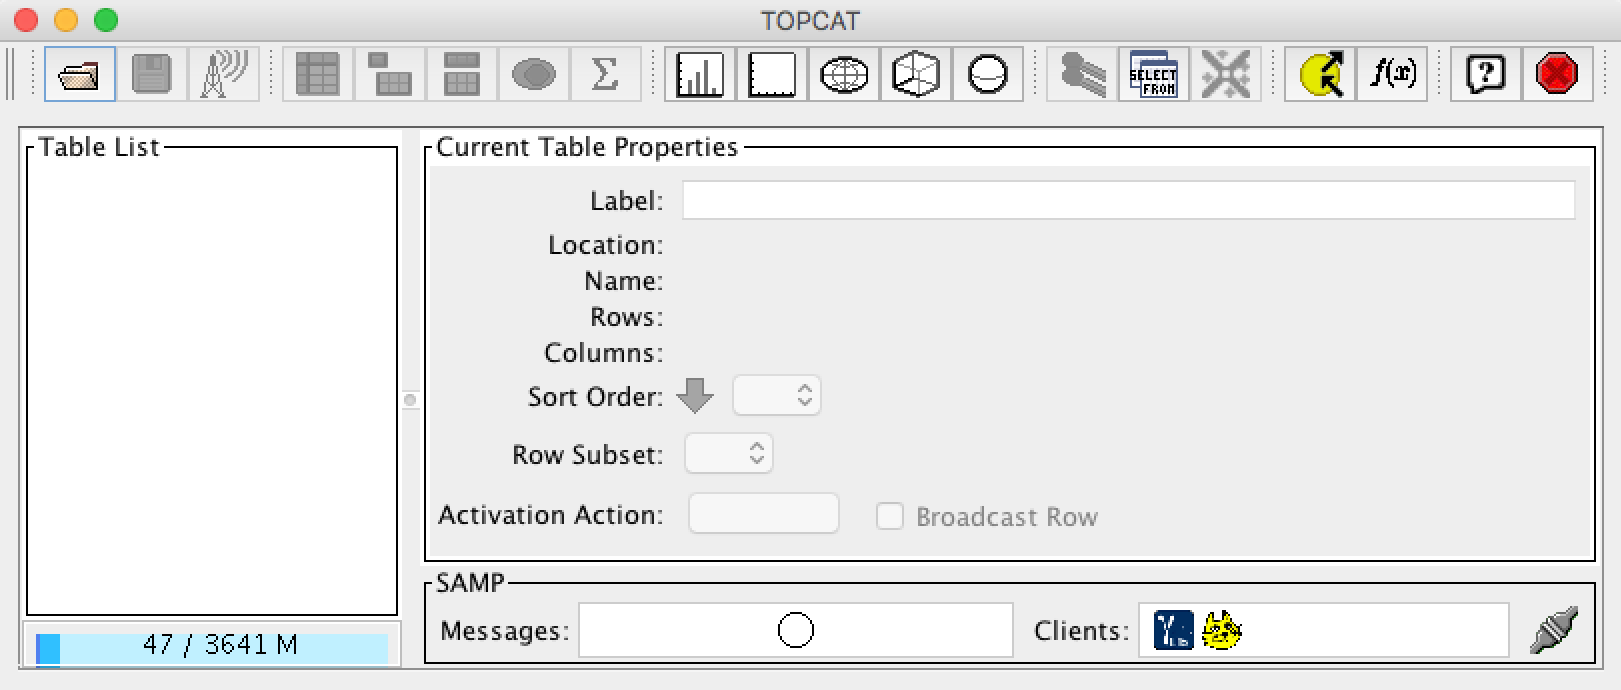
Topcat application after start-up
Then run ctselect for event selection and specify publish=yes as
argument after the tool name:
$ ctselect publish=yes
Input event list or observation definition XML file [events.fits] selected_gps_baseline_110380.fits
Radius of ROI around pointing or specified RA/DEC (degrees) (0-180) [3.0] NONE
Start time (UTC string, JD, MJD or MET in seconds) [NONE]
Lower energy limit (TeV) [0.1] 0.2
Upper energy limit (TeV) [100.0] 50.0
Output event list or observation definition XML file [selected_events.fits]
Once ctselect has terminated, the resulting event list will automatically appear in the Topcat application (see below).
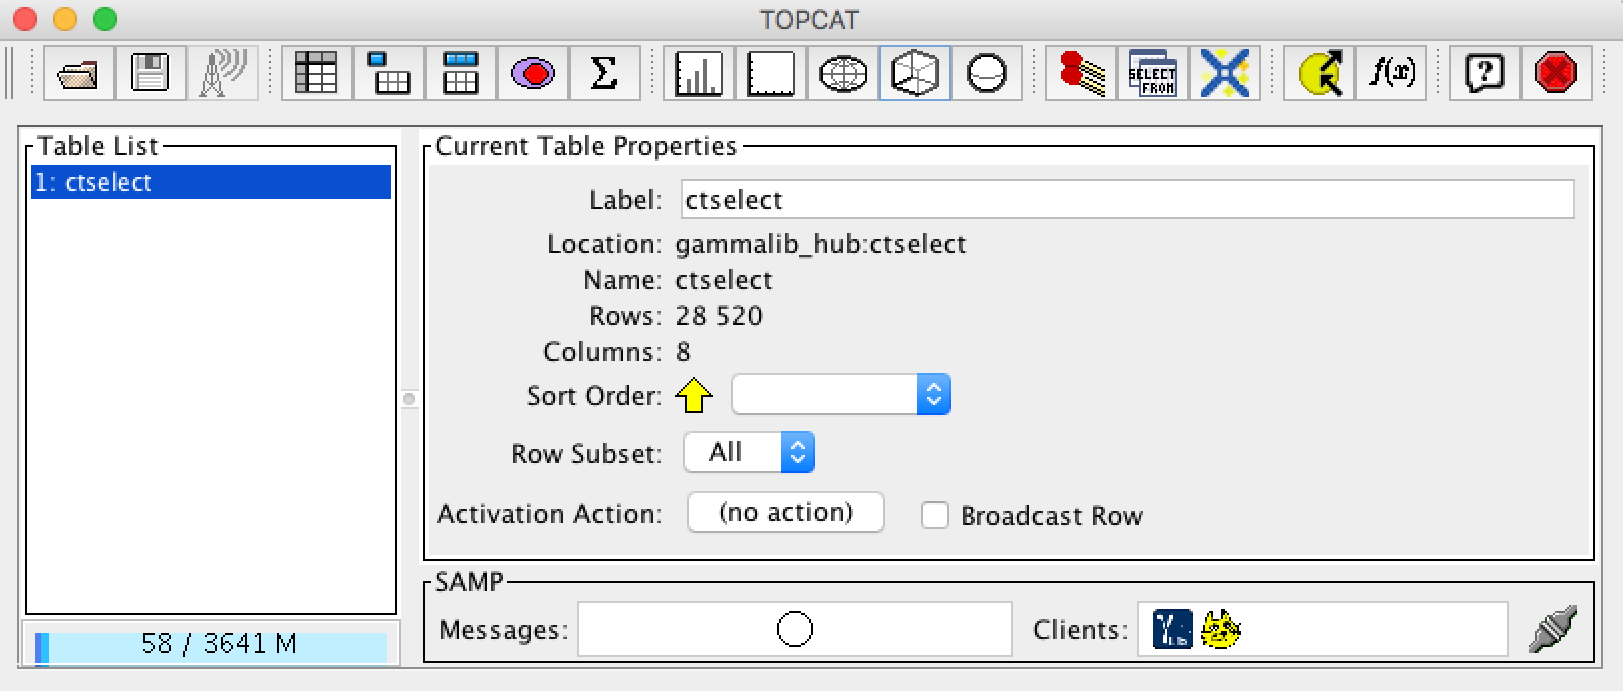
Topcat application after ctselect finished execution
You can now open the 3-dimensional display tab and visualise the data in a coordinate system that is spanned by Right Ascension, Declination and energy (see below).
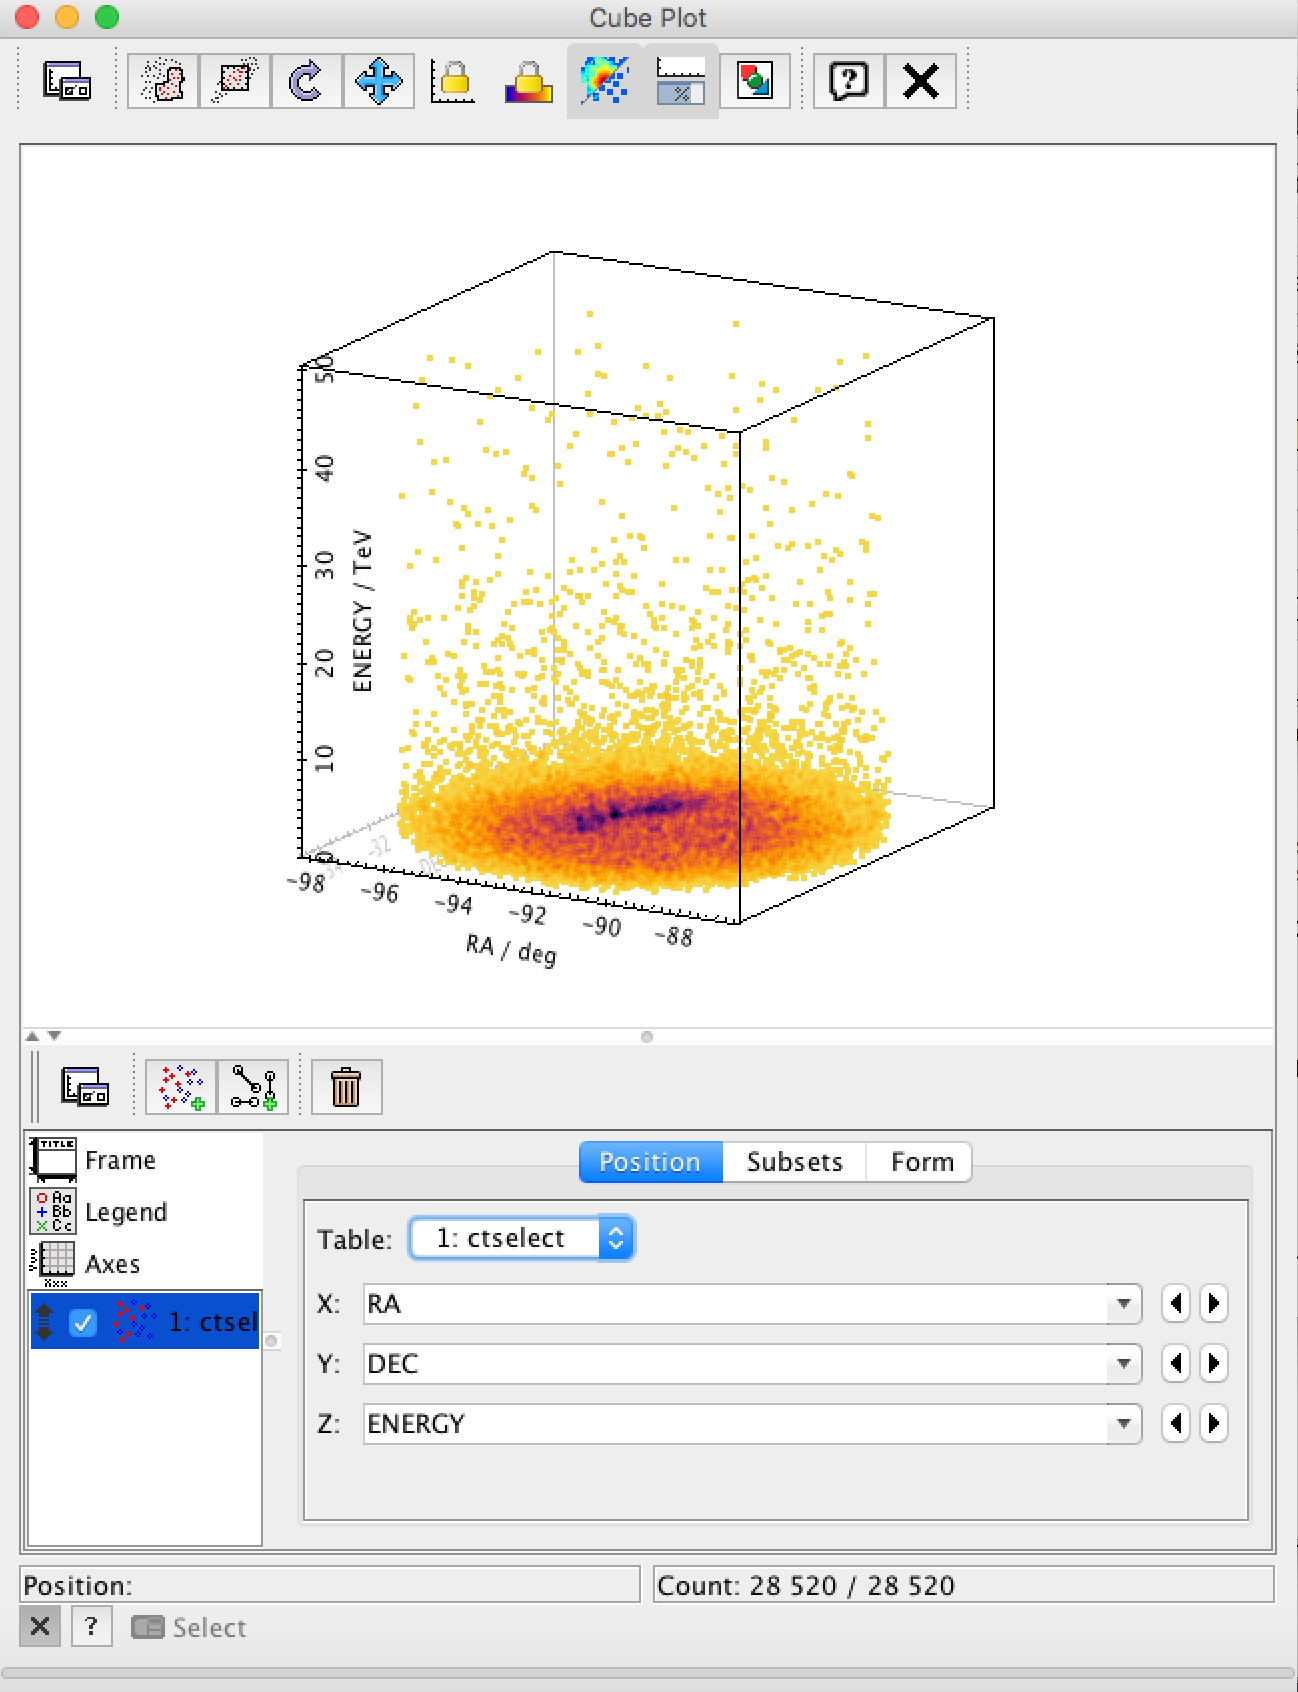
Display of event list in 3-dimensional representation
Below the list of tools and scripts that interact with Virtual Observatory tools.
Tool or script
Object
VO tool (example)
Table
Topcat
Image
Aladin
Table
Topcat
Image
Aladin
Image
Aladin
Image
Aladin
Image
Aladin
Image
Aladin
Image
Aladin
Image
Aladin
Table
Topcat
Table
Topcat
Table
Topcat
Table
Topcat
Image
Aladin
Image
Aladin