Fitting the model components directly to the events
What you will learn
You will learn how to analyse the event data using an unbinned maximum likelihood analysis.
Use an unbinned maximum likelihood analysis if you have doubts about the impact of the selected binning on your analysis and if the number of observations is not too large (typically a few tens of 30 minute observations). Or if you simply do not worry about computation time.
Instead of binning the events into a counts cube and computing the effective instrument response functions you can directly fit the model to the events using an unbinned maximum likelihood analysis. The advantage of the unbinned analysis is that the event time remains an explicit quantity of the analysis and that the different observations together with their instrument response functions are kept separate. In addition, no binning is performed and the analysis takes full advantage of the information carried by each individual event. The drawback is that the computing time scales linearly with the number of events and the number of observations, becoming evetually prohibitive for the analysis of large volumes of data (but for the analysis of small junks of data the unbinned analysis is in fact faster than the stacked analysis).
To perform an unbinned model fitting you provide the observation definition file referencing the event lists as input to the ctlike tool:
$ ctlike
Input event list, counts cube or observation definition XML file [cntcube.fits] obs_selected.xml
Input model definition XML file [bkgcube_eplaw_iem.xml] models_eplaw.xml
Output model definition XML file [results_stacked_eplaw_iem.xml] results_unbinned_eplaw.xml
The tool will take a few minutes (on Mac OS X) to perform the model fitting,
and will write the results into an updated
model definition file
containing the fitted model parameters and their statistical uncertainties.
You may inspect the log file ctlike.log to verify that the model fit
converged properly, as illustrated in the example below:
2019-04-08T09:07:55: +=================================+
2019-04-08T09:07:55: | Maximum likelihood optimisation |
2019-04-08T09:07:55: +=================================+
2019-04-08T09:08:59:  >Iteration   0: -logL=20943561.913, Lambda=1.0e-03
2019-04-08T09:10:00:  >Iteration   1: -logL=20918670.241, Lambda=1.0e-03, delta=24891.672, step=1.0e+00, max(|grad|)=58029.396529 [Index:26]
2019-04-08T09:11:01:  >Iteration   2: -logL=20913349.801, Lambda=1.0e-04, delta=5320.440, step=1.0e+00, max(|grad|)=5850.894621 [RA:0]
2019-04-08T09:12:04:  >Iteration   3: -logL=20911154.917, Lambda=1.0e-05, delta=2194.884, step=1.0e+00, max(|grad|)=4316.126017 [RA:0]
2019-04-08T09:13:05:  >Iteration   4: -logL=20910268.971, Lambda=1.0e-06, delta=885.946, step=1.0e+00, max(|grad|)=2582.430399 [RA:0]
2019-04-08T09:14:07:  >Iteration   5: -logL=20910125.113, Lambda=1.0e-07, delta=143.859, step=1.0e+00, max(|grad|)=1071.357032 [RA:0]
2019-04-08T09:15:08:  >Iteration   6: -logL=20910109.424, Lambda=1.0e-08, delta=15.689, step=1.0e+00, max(|grad|)=332.605987 [RA:0]
2019-04-08T09:16:10:  >Iteration   7: -logL=20910107.964, Lambda=1.0e-09, delta=1.460, step=1.0e+00, max(|grad|)=-100.227262 [RA:7]
2019-04-08T09:17:13:  >Iteration   8: -logL=20910107.928, Lambda=1.0e-10, delta=0.036, step=1.0e+00, max(|grad|)=-62.422960 [RA:7]
2019-04-08T09:18:13:  >Iteration   9: -logL=20910107.921, Lambda=1.0e-11, delta=0.007, step=1.0e+00, max(|grad|)=-38.916864 [RA:7]
2019-04-08T09:19:14:  >Iteration  10: -logL=20910107.919, Lambda=1.0e-12, delta=0.003, step=1.0e+00, max(|grad|)=-24.284973 [RA:7]
2019-04-08T09:20:15:
2019-04-08T09:20:15: +=========================================+
2019-04-08T09:20:15: | Maximum likelihood optimisation results |
2019-04-08T09:20:15: +=========================================+
2019-04-08T09:20:15: === GOptimizerLM ===
2019-04-08T09:20:15:  Optimized function value ..: 20910107.919
2019-04-08T09:20:15:  Absolute precision ........: 0.005
2019-04-08T09:20:15:  Acceptable value decrease .: 2
2019-04-08T09:20:15:  Optimization status .......: converged
2019-04-08T09:20:15:  Number of parameters ......: 29
2019-04-08T09:20:15:  Number of free parameters .: 19
2019-04-08T09:20:15:  Number of iterations ......: 10
2019-04-08T09:20:15:  Lambda ....................: 1e-13
2019-04-08T09:20:15:  Maximum log likelihood ....: -20910107.919
2019-04-08T09:20:15:  Observed events  (Nobs) ...: 3084595.000
2019-04-08T09:20:15:  Predicted events (Npred) ..: 3084591.995 (Nobs - Npred = 3.00508165732026)
Also the ctbutterfly tool and the csspec and csresmap
scripts can be run into unbinned mode by providing the
observation definition file
instead of the counts cube on input.
For illustration, the butterfly diagrams and spectra obtained for Src001
and Src002 using an unbinned maximum likelihood analysis are shown
below.
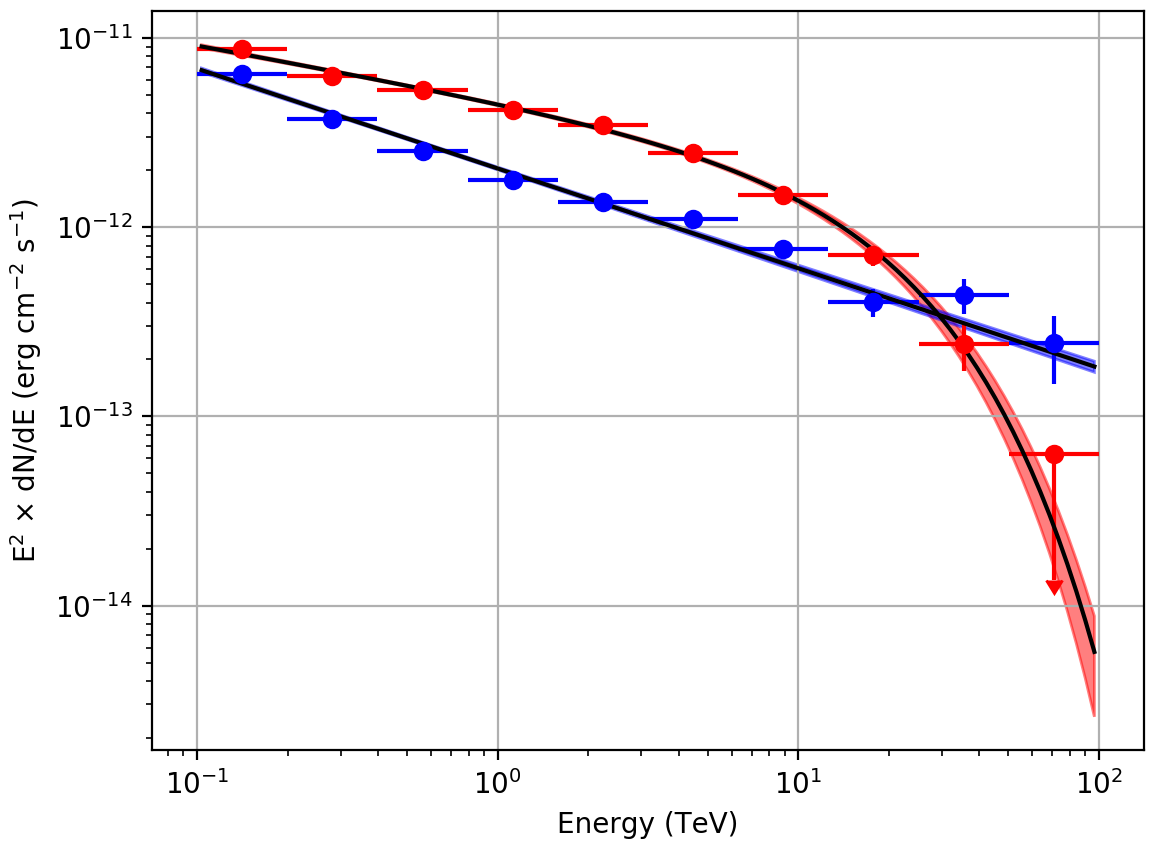
Butterfly diagrams determined with ctbutterfly and spectral points obtained with csspec using an unbinned analysis