Generate a spectral energy distribution for a source
What you will learn
You will learn how to use csspec to derive the spectral energy density of a source from Fermi-LAT data.
To determine a spectrum of the Vela pulsar you can use the csspec script. To do this, type
$ csspec
Input event list, counts cube, or observation definition XML file [events.fits] obs.xml
Input model definition XML file [$CTOOLS/share/models/crab.xml] vela_results.xml
Source name [Crab] Vela
Spectrum generation method (SLICE|NODES|AUTO) [AUTO]
Algorithm for defining energy bins (FILE|LIN|LOG|POW) [LOG]
Start value for first energy bin in TeV [0.1] 0.0001
Stop value for last energy bin in TeV [100.0] 0.1
Number of energy bins (1-200) [20] 10
Output spectrum file [spectrum.fits]
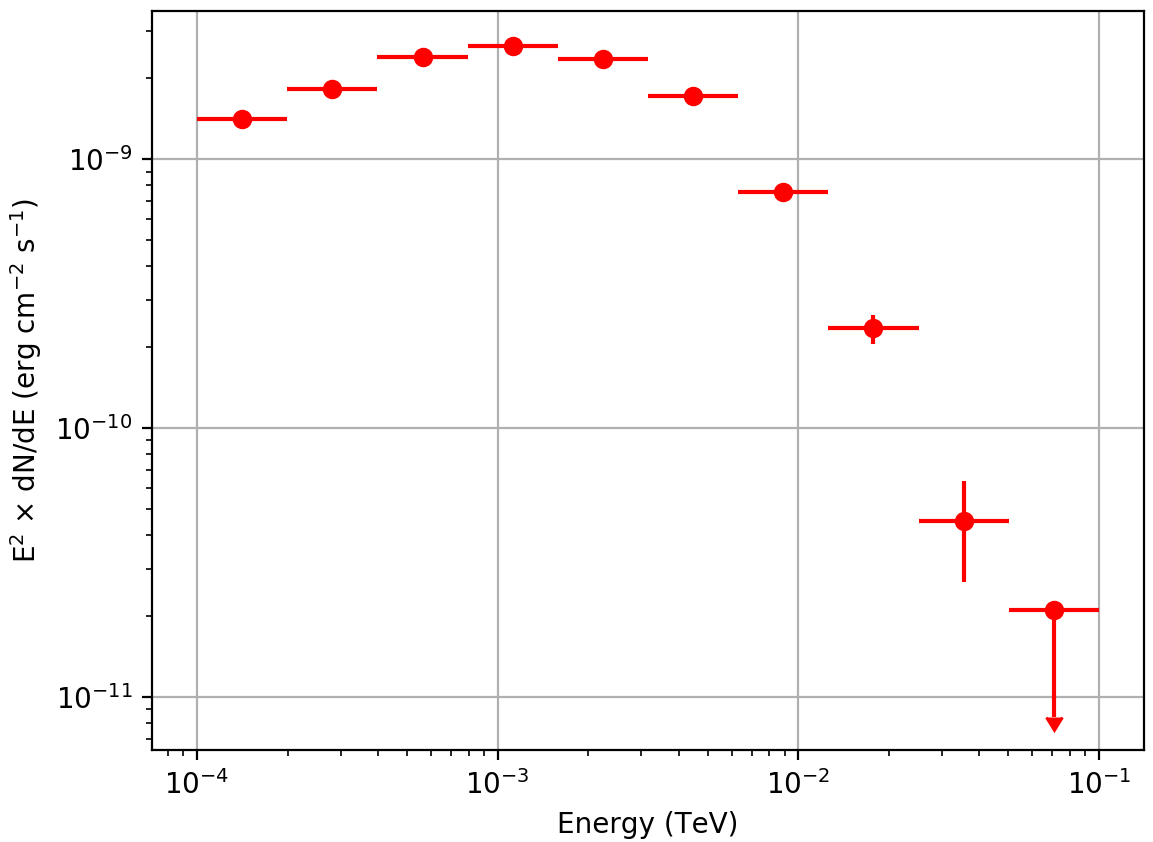
This will generate a logarithmically spaced spectrum composed of 10 energy bins
comprised within 100 MeV and 100 GeV. The csspec tool is run in the AUTO
mode, which for Fermi-LAT data corresponds to the NODES method. csspec
will convert the Vela spectrum in the input model into a node function and fit
all intensity nodes using ctlike. The resulting node intensities are
then interpreted as the spectral point, and are displayed graphically below:
Note
The figure was created using the show_spectrum.py script that is
located in the ctools example folder. The example script requires the
matplotlib Python module for display.
You may reproduce the plot by typing
$ $CTOOLS/share/examples/python/show_spectrum.py spectrum.fits
