Generate a Test Statistic map
What you will learn
You will learn how to use cttsmap to generate a Test Staristic map from COMPTEL data.
The Test Statistic (or maximum likelihood ratio) is a measure of the detection significance of a gamma-ray source. By displacing the location of a test source on a grid of positions you can generate a Test Statistic map that helps in finding significant source and assessing the position uncertainty of a source. You do this by using the cttsmap tool as follows:
$ cttsmap
Input event list, counts cube or observation definition XML file [events.fits] obs.xml
Test source name [Crab]
Input model definition XML file [$CTOOLS/share/models/crab.xml] models.xml
Coordinate system (CEL - celestial, GAL - galactic) (CEL|GAL) [CEL]
Projection method (AIT|AZP|CAR|GLS|MER|MOL|SFL|SIN|STG|TAN) [CAR]
First coordinate of image center in degrees (RA or galactic l) (0-360) [83.63]
Second coordinate of image center in degrees (DEC or galactic b) (-90-90) [22.01]
Image scale (in degrees/pixel) [0.02] 1.0
Size of the X axis in pixels [200] 10
Size of the Y axis in pixels [200] 10
Output Test Statistic map file [tsmap.fits]
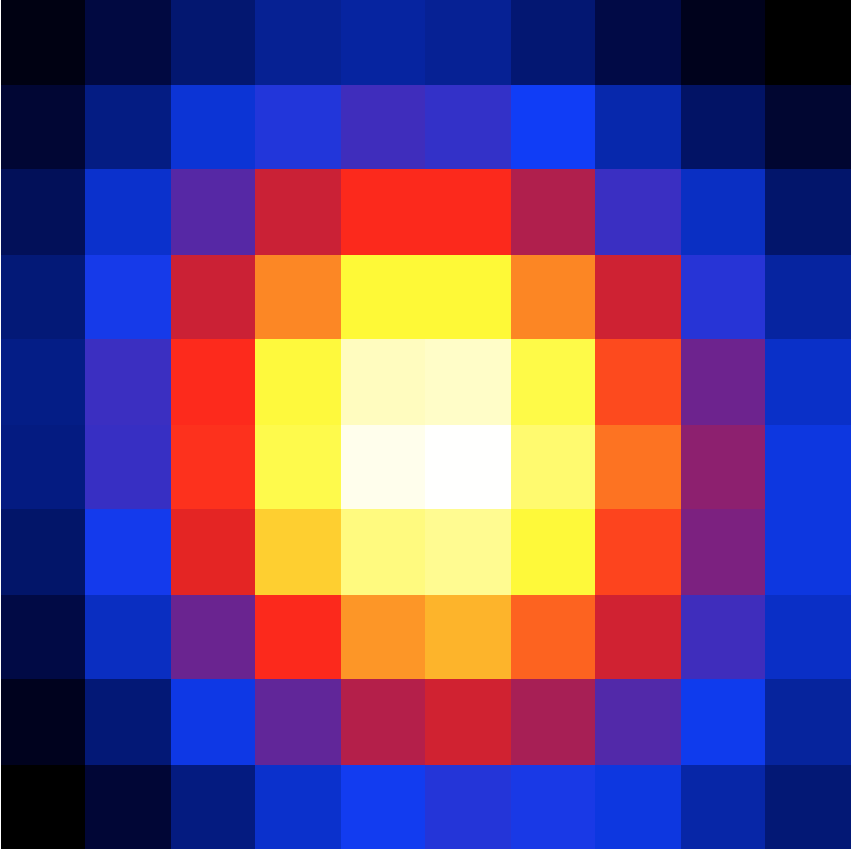
cttsmap created a 10 x 10 pixels map with a pixel size of 1 degree
around the location of the Crab and saved the result in the FITS file
tsmap.fits. The file also contains the values of all fitted parameters
at each grid position. The Test Statistics map is displayed using
ds9 in the figure below:
