Binning event data
What you will learn
You will learn how to use the ctbin tool to bin the selected event data into a counts cube.
A counts cube is a 3-dimensional data cube that is spanned by Right Ascension (or Galactic longitude), Declination (or Galactic latitude), and energy (by default logarithmically spaced, but this is under your control).
Let’s now bin the selected event data into a counts cube. You do this using the ctbin tool as follows:
$ ctbin
Input event list or observation definition XML file [events.fits] selected_events.fits
Coordinate system (CEL - celestial, GAL - galactic) (CEL|GAL) [CEL]
Projection method (AIT|AZP|CAR|GLS|MER|MOL|SFL|SIN|STG|TAN) [CAR]
First coordinate of image center in degrees (RA or galactic l) (0-360) [83.63]
Second coordinate of image center in degrees (DEC or galactic b) (-90-90) [22.51]
Image scale (in degrees/pixel) [0.02]
Size of the X axis in pixels [200]
Size of the Y axis in pixels [200]
Algorithm for defining energy bins (FILE|LIN|LOG|POW) [LOG]
Lower energy limit (TeV) [0.1]
Upper energy limit (TeV) [100.0]
Number of energy bins (1-200) [20]
Output counts cube file or observation definition XML file [cntcube.fits]
In this example the events from file selected_events.fits will be binned
into a counts cube stored into the file cntcube.fits. The counts cube
is centred on the pointing direction (Right Ascension 83.63 deg,
Declination 22.51 deg). A cartesian projection aligned in celestial
coordinates is used and the counts cube has
200 x 200 spatial pixels of 0.02 x 0.02 degrees in size, covering
an area of 4 deg x 4 deg, and 20 logarithmically spaced energy bins, covering
an energy range from 0.1 TeV to 100 TeV.
The cntcube.fits file produced by ctbin contains four extensions:
- A primary 3-dimensional image extension providing the number of events per counts cube bin,
- a 3-dimensional image extension
WEIGHTwhere each bin gives the fractional overlap between a counts cube bin and the Region of Interest covered by the event list, - a table extension
EBOUNDSthat defines the energy boundaries of the counts cube, and - a table extension
GTIthat defines the Good Time Intervals of the counts cube.
The following image shows the cntcube.fits file produced in the example
above. The EBOUNDS table has 20 rows, one for each energy bin, while the
GTI table has just a single row, indicating the start and stop time of the
simulated data.
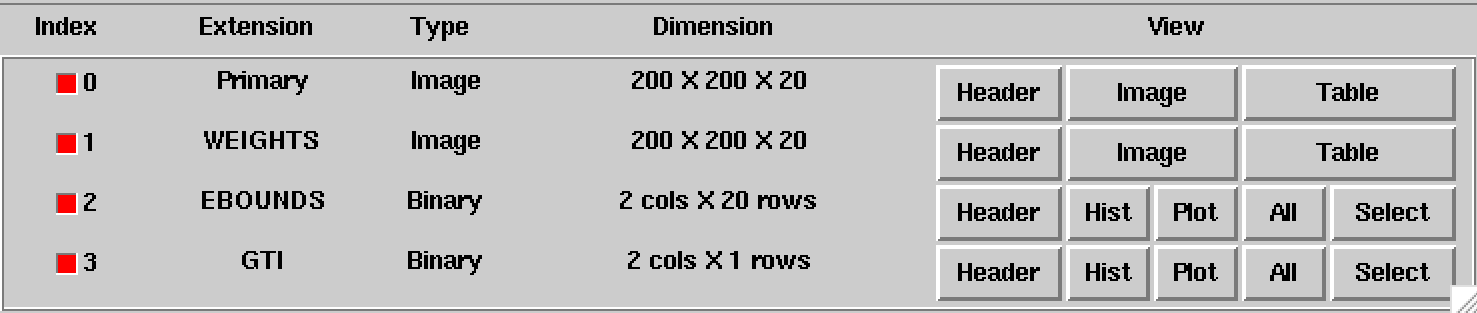
Extensions of the counts cube FITS file
An image of the first bin, covering the energy range 100 - 141 GeV, is shown below:
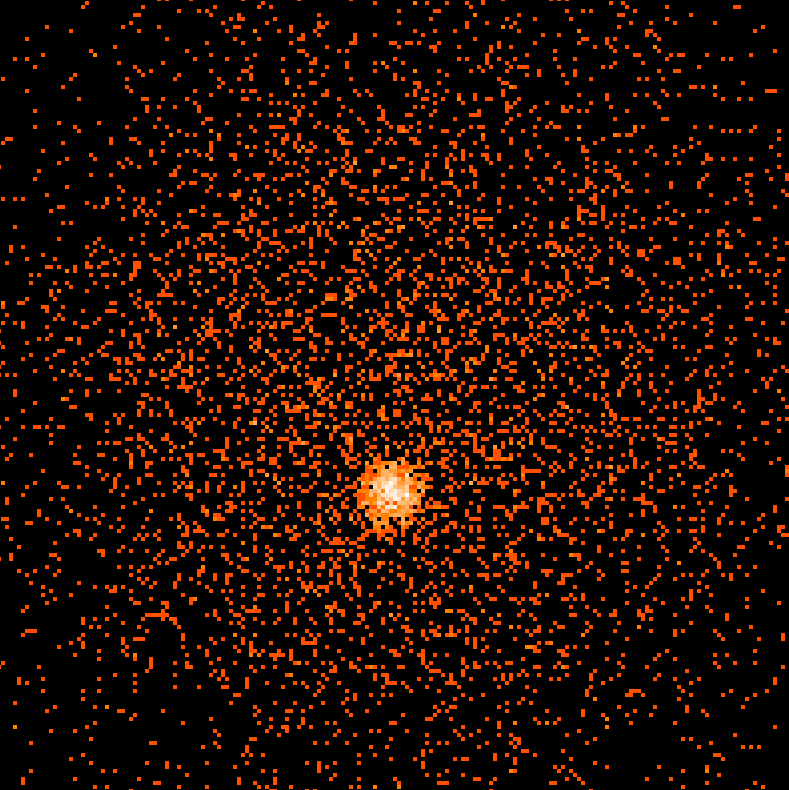
Image of first energy bin of the counts cube
For illustration, the last few lines of the log file ctbin.log are
reproduced below:
2019-04-02T13:46:34: +=================+
2019-04-02T13:46:34: | Bin observation |
2019-04-02T13:46:34: +=================+
2019-04-02T13:46:34: === CTA observation (id=000001) ===
2019-04-02T13:46:34:  Events in list ............: 22708
2019-04-02T13:46:34:  Events in cube ............: 19452
2019-04-02T13:46:34:  Events outside RoI ........: 0
2019-04-02T13:46:34:  Events with invalid WCS ...: 0
2019-04-02T13:46:34:  Events outside cube area ..: 3256
2019-04-02T13:46:34:  Events outside energy bins : 0
From the 22708 events that were simulated and stored in the
selected_events.fits file, 19452 lie within the cube boundaries and are thus
put into the resulting counts cube.