Generate a butterfly diagram
What you will learn
You will learn how to use ctbutterfly to create a butterfly diagram for a model component from Fermi-LAT data.
A butterfly diagram shows the envelope of all spectral models that are statistically compatible with the data. You can create such a butterfly diagram for the Vela pulsar using the ctbutterfly tool by providing the model definition file output file from ctlike as input:
$ ctbutterfly
Input event list, counts cube or observation definition XML file [events.fits] obs.xml
Source of interest [Crab] Vela
Input model definition XML file [$CTOOLS/share/models/crab.xml] vela_results.xml
Start value for first energy bin in TeV [0.1] 0.0001
Stop value for last energy bin in TeV [100.0] 0.1
Output ASCII file [butterfly.txt]
ctbutterfly produces the ASCII file butterfly.txt that contains
the envelope of the butterfly diagram. The figure below gives a graphical
representation of the envelope.
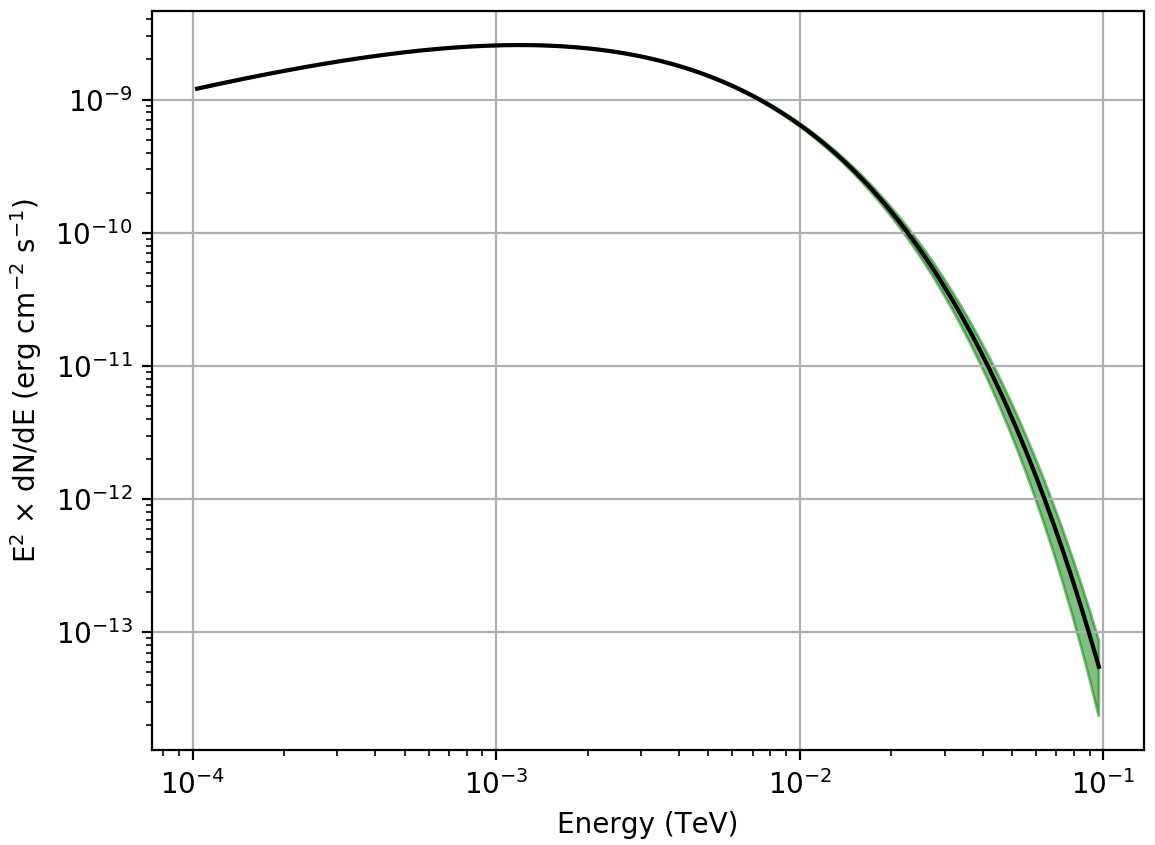
Butterfly diagram of the fitted Vela pulsar spectrum
Note
The figure was created using the show_butterfly.py script that is
located in the ctools example folder. The example script requires the
matplotlib Python module for display.
You may reproduce the plot by typing
$ $CTOOLS/share/examples/python/show_butterfly.py butterfly.txt