How to generate a phase curve of a pulsar?
What you will learn
You will learn how to derive a phase curve for a pulsar.
To determine the phase curve of a pulsar you first need the ephemerides of the pulsar of interest. In this example we suppose that you want to analyse the Vela Pulsar which for an epoch of 54686.2 (MJD) has the following ephemerides:
\(f = 11.19 \, {\rm s}^{-1}\)
\(\dot{f} = -1.55 \, 10^{-11} \, {\rm s}^{-2}\)
\(\ddot{f} = 6.46 \, 10^{-23} \, {\rm s}^{-3}\)
You need to enter these ephemerides into a model definition file with the following structure (note that the spectral and spatial information is irrelevant for this example):
<?xml version="1.0" encoding="UTF-8" standalone="no"?>
<source_library title="source library">
  <source name="VelaPulsar" type="PointSource">
    <spectrum type="PowerLaw">
      <parameter name="Prefactor"   scale="1e-14" value="19.4" min="1e-07" max="1000.0" free="1"/>
      <parameter name="Index"       scale="-1"    value="4.45" min="0.0"   max="+10.0"  free="1"/>
      <parameter name="PivotEnergy" scale="1e3"   value="20.0" min="0.01"  max="1000.0" free="0"/>
    </spectrum>
    <spatialModel type="PointSource">
      <parameter name="RA"  scale="1" value="128.838" min="-360" max="360" free="0"/>
      <parameter name="DEC" scale="1" value="-45.178" min="-90"  max="90"  free="0"/>
    </spatialModel>
    <temporal type="PhaseCurve" file="$CTADATA/models/phasecurve_J0835-4510.fits">
      <parameter name="Normalization" scale="1"         value="1.0"     min="0.0"   max="1000.0"   free="0"/>
      <parameter name="MJD"           scale="1"         value="54686.2" min="0.0"   max="100000.0" free="0"/>
      <parameter name="Phase"         scale="1"         value="0.0"     min="0.0"   max="1.0"      free="0"/>
      <parameter name="F0"            scale="1"         value="11.19"   min="0.0"   max="1000.0"   free="0"/>
      <parameter name="F1"            scale="1e-11"     value="-1.55"   min="-10.0" max="1000.0"   free="0"/>
      <parameter name="F2"            scale="1e-23"     value="6.46"    min="0.0"   max="1000.0"   free="0"/>
    </temporal>
  </source>
</source_library>
As next step you need to select all observations from the data with pointing directions close to the Vela pulsar. In the example below, all observations from the Galactic Plane Scan with pointing directions within 5 degrees of the Vela pulsar are selected:
$ csobsselect
Input event list or observation definition XML file [obs.xml] $CTADATA/obs/obs_gps_baseline.xml
Pointing selection region shape (CIRCLE|BOX) [CIRCLE]
Coordinate system (CEL - celestial, GAL - galactic) (CEL|GAL) [CEL]
Right Ascension of selection centre (deg) (0-360) [83.63] 128.838
Declination of selection centre (deg) (-90-90) [22.01] -45.178
Radius of selection circle (deg) (0-180) [5.0]
Start time (UTC string, JD, MJD or MET in seconds) [NONE] NONE
Output observation definition XML file [outobs.xml] obs_vela.xml
This results in a selection of 45 observations from the Galactic Plane Survey
that will be compiled in the obs_vela.xml
observation definition file.
Now you can compute the phase for every event in your selection using the
ephemerides of the Vela pulsar. You do this with the ctphase tool
as follows:
$ ctphase
Input event list or observation definition XML file [events.fits] obs_vela.xml
Model definition XML file [$CTOOLS/share/models/crab.xml] $CTOOLS/share/models/1dc_howto_velapsr.xml
Source in model definition XML file to use for phase computation [Crab] VelaPulsar
Output event list or observation definition XML file [phased_events.fits] obs_vela_phased.xml
This produces a new
observation definition file
obs_vela_phased.xml that points to event files to which a PHASE
column was added. The format of the event files is dislayed below. Each event
has now an associated phase value that was computed from the trigger time of
the event.
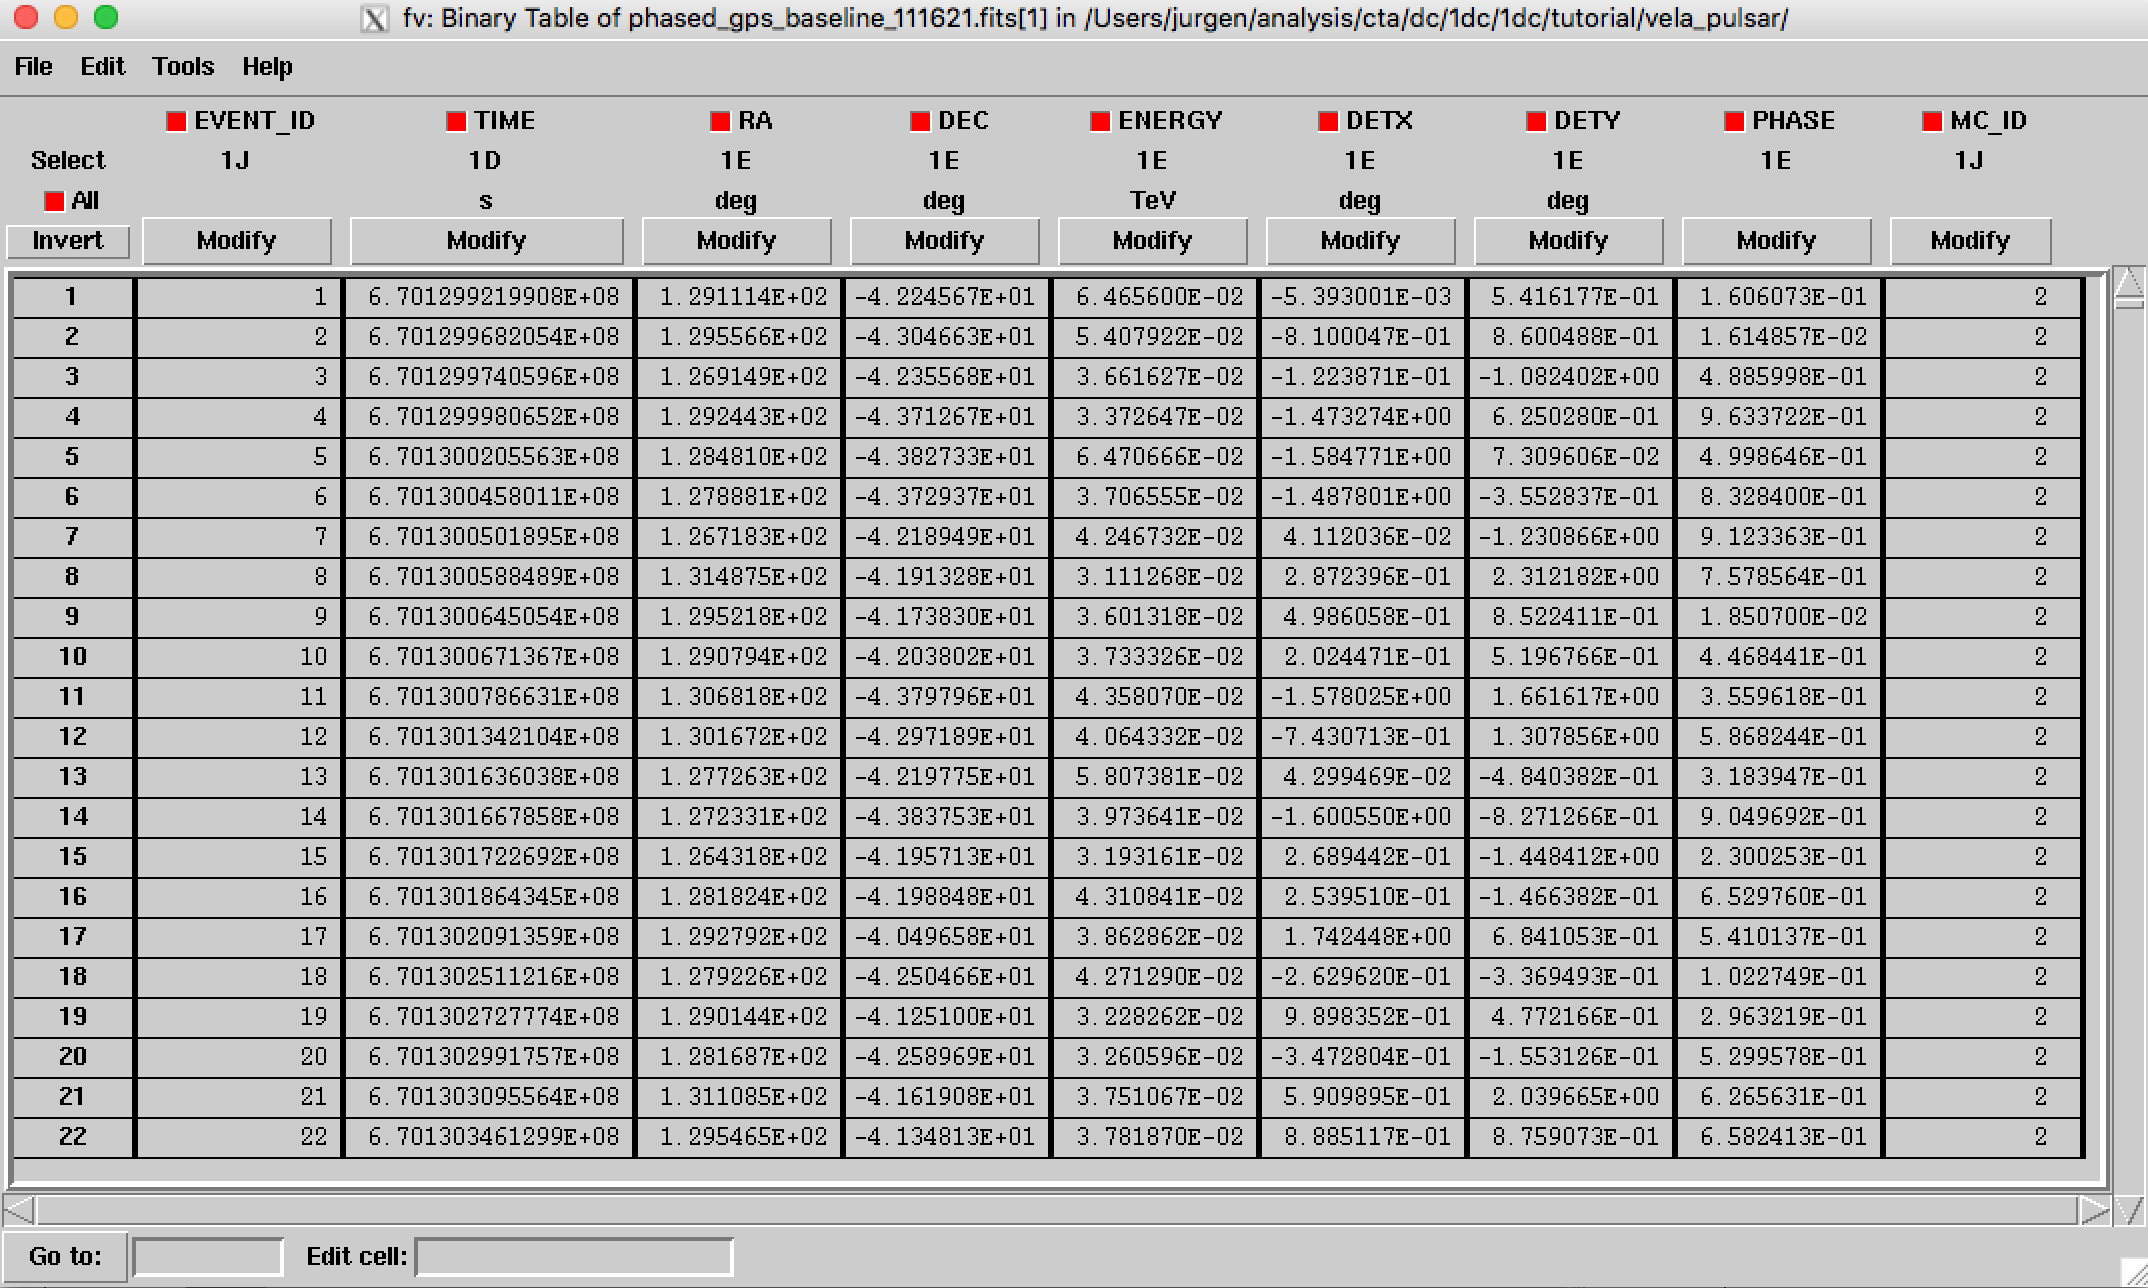
Event list file with phase information for the Vela pulsar
To generate now a phase curve of the Vela pulsar you need to select all events that are close to the source using the ctselect tool. To select for example all events within 0.2 degrees of the Vela pulsar you need to type the following:
$ ctselect usepnt=no
Input event list or observation definition XML file [events.fits] obs_vela_phased.xml
RA for ROI centre (degrees) (0-360) [83.63] 128.838
Dec for ROI centre (degrees) (-90-90) [22.51] -45.178
Radius of ROI around pointing or specified RA/DEC (degrees) (0-180) [3.0] 0.2
Start time (UTC string, JD, MJD or MET in seconds) [NONE]
Lower energy limit (TeV) [0.1] 0.03
Upper energy limit (TeV) [100.0] 160.0
Output event list or observation definition XML file [selected_events.fits] obs_vela_phased_selected.xml
Note
By default ctselect selects events around the pointing direction.
To select the events around a different sky direction, the hidden usepnt=no
has to be passed to the tool.
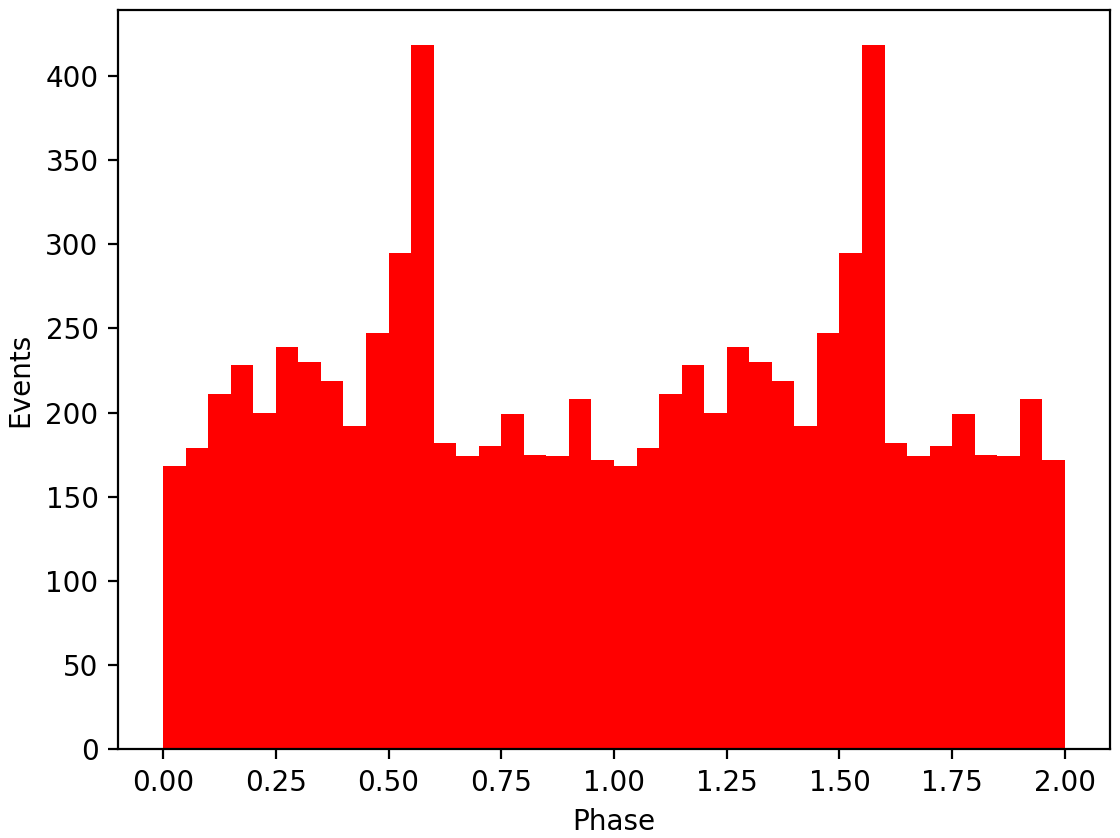
The selected events as a function of phase are displayed below. There is a clear indication for a phase dependence of the event rate.
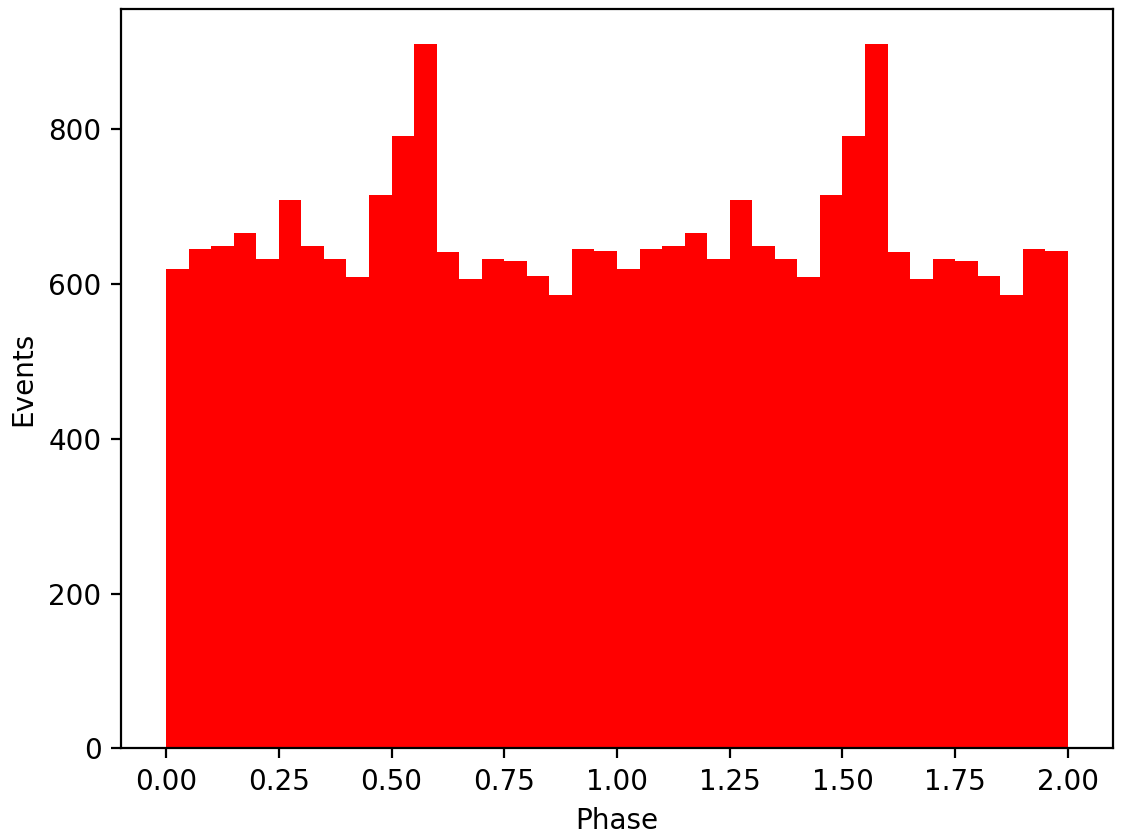
Phase histogram for events selected within 0.2 degrees of the Vela pulsar
An alternative method to select events from the observation definition file is based on the computation of the probability that the event arises from a specific model component. To perform such a computation you have to
add a background model component, and
drop the temporal component from the Vela pulsar
in the model definition file. The resulting model definition file should look as follows:
<?xml version="1.0" encoding="UTF-8" standalone="no"?>
<source_library title="source library">
  <source name="VelaPulsar" type="PointSource">
    <spectrum type="PowerLaw">
      <parameter name="Prefactor"   scale="1e-14" value="19.4" min="1e-07" max="1000.0" free="1"/>
      <parameter name="Index"       scale="-1"    value="4.45" min="0.0"   max="+10.0"  free="1"/>
      <parameter name="PivotEnergy" scale="1e3"   value="20.0" min="0.01"  max="1000.0" free="0"/>
    </spectrum>
    <spatialModel type="PointSource">
      <parameter name="RA"  scale="1" value="128.838" min="-360" max="360" free="0"/>
      <parameter name="DEC" scale="1" value="-45.178" min="-90"  max="90"  free="0"/>
    </spatialModel>
  </source>
  <source name="Background" type="CTAIrfBackground" instrument="CTA">
    <spectrum type="PowerLaw">
      <parameter name="Prefactor"   value="1" scale="1" min="0"            free="1"/>
      <parameter name="Index"       value="0" scale="1" min="-10" max="10" free="1"/>
      <parameter name="PivotEnergy" value="1" scale="1000000"              free="0"/>
    </spectrum>
  </source>
</source_library>
You can then run the ctprob tool that computes the probability that an event arises either from the source or from the background component:
$ ctprob
Input event list or observation definition XML file [events.fits] obs_vela_phased.xml
Input model definition XML file [$CTOOLS/share/models/crab.xml] $CTOOLS/share/models/1dc_howto_vela.xml
Output event list or observation definition XML file [prob_events.fits] obs_vela_phased_prob.xml
This produces a new
observation definition file
obs_vela_phased_prob.xml that points to event files to which the
PROB_VelaPulsar and PROB_Background columns have been added.
The format of the file is dislayed below. Each event has now an associated
probability value for all model components.
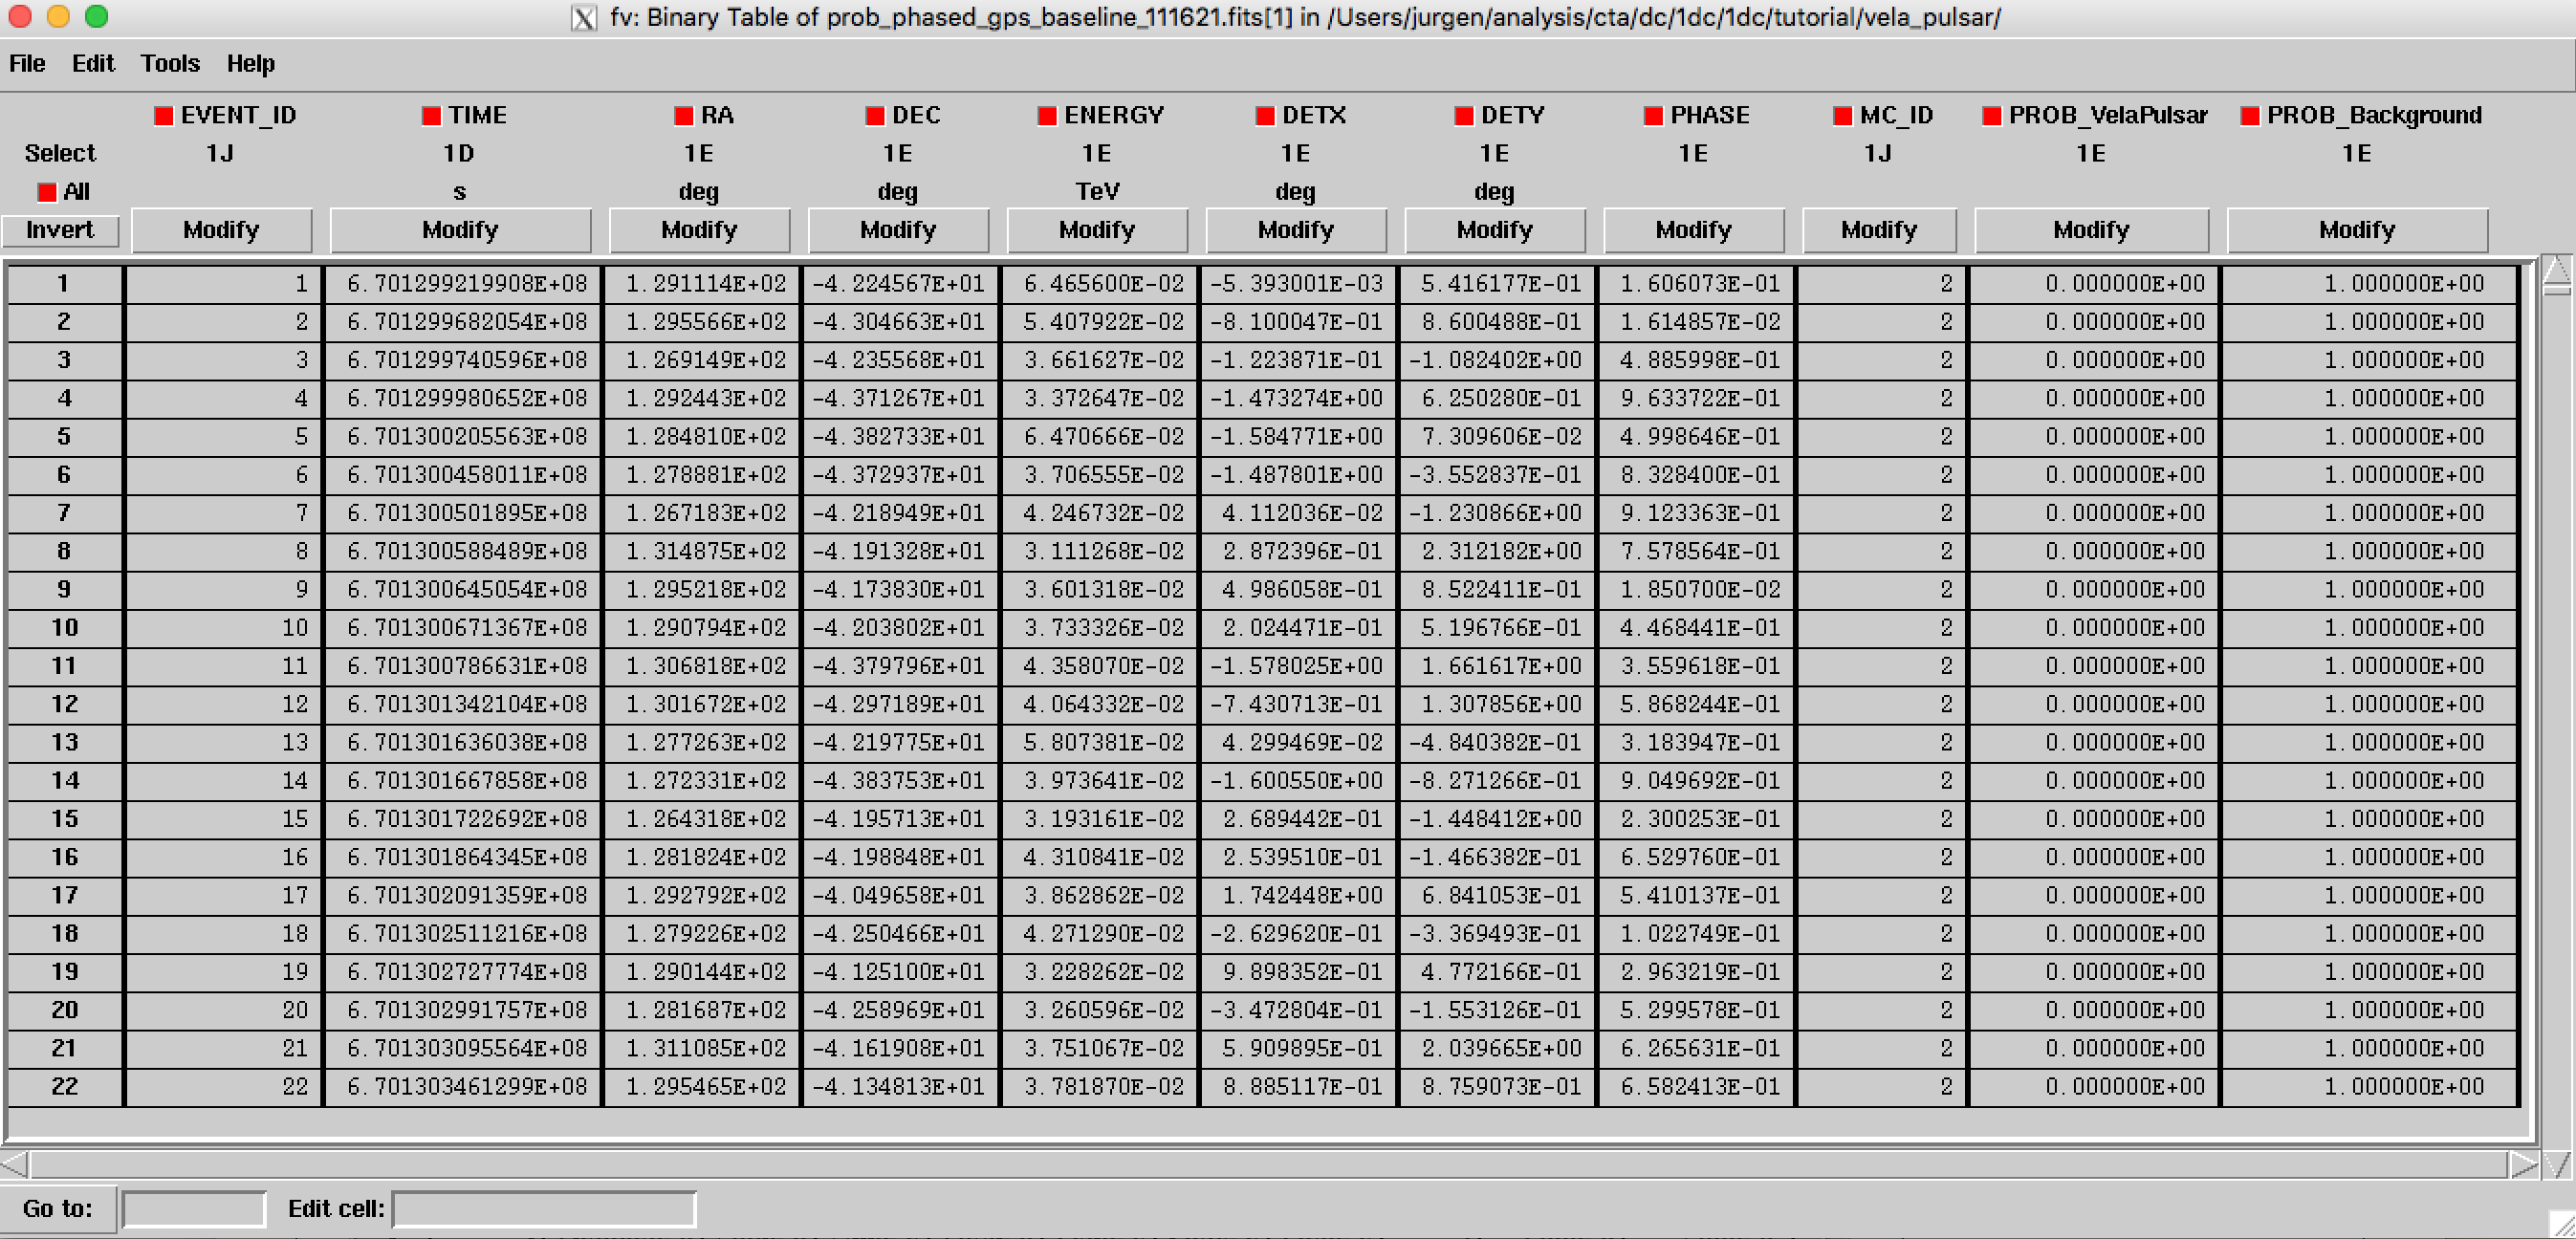
Event list file with phase and probability information for the Vela pulsar and probability information for the background model
You now can perform an event selection based on the probability that an event
originates from the Vela pulsar. In the following example we set the
probability threshold to >10% by adding the attribute
expr="PROB_VelaPulsar>0.1" after the ctselect command:
$ ctselect expr="PROB_VelaPulsar>0.1" usepnt=no forcesel=yes
Input event list or observation definition XML file [obs_vela_phased.xml] obs_vela_phased_prob.xml
RA for ROI centre (degrees) (0-360) [128.838]
Dec for ROI centre (degrees) (-90-90) [-45.178]
Radius of ROI around pointing or specified RA/DEC (degrees) (0-180) [0.2] 5.0
Start time (UTC string, JD, MJD or MET in seconds) [NONE]
Lower energy limit (TeV) [0.03]
Upper energy limit (TeV) [160.0]
Output event list or observation definition XML file [obs_vela_phased_selected.xml] obs_vela_phased_prob_selected.xml
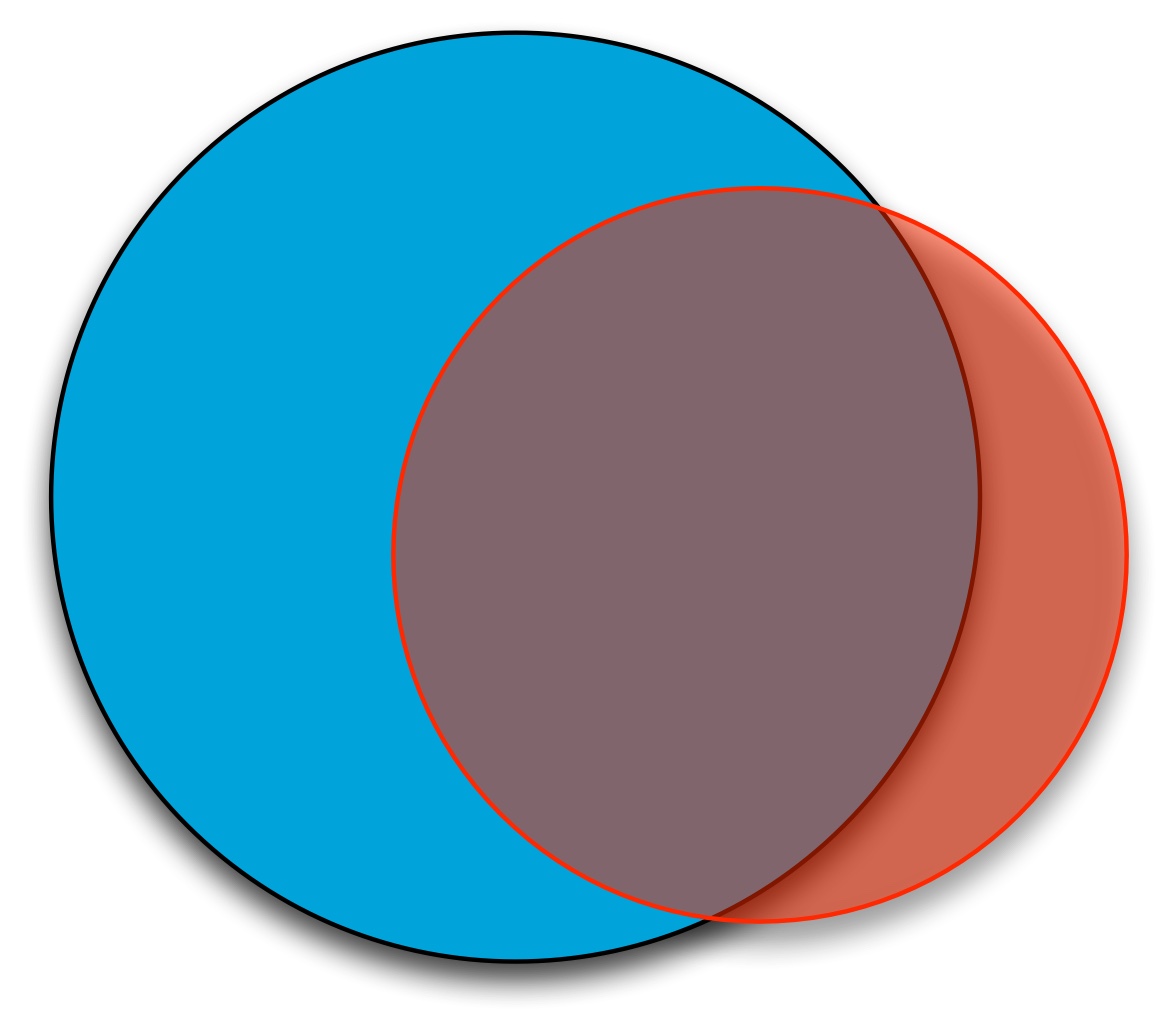
Warning
The forcesel=yes option is required to accomodate for non-overlapping
regions of interests (ROIs). The situation is illustrated in the figure
below. Due to the large radius of 5 degrees, the ROI selection (red) does
not fully overlap with the field of view of the observations (blue), leading
to a non-circular selection region (grey). Such data cannot be used for an
unbinned maximum likelihood analysis which always requires circular selection
regions. However, for data display, as intended here, such a selection may
make sense. But you should never try fitting such data using ctlike
or any other maximum likelihood tool.
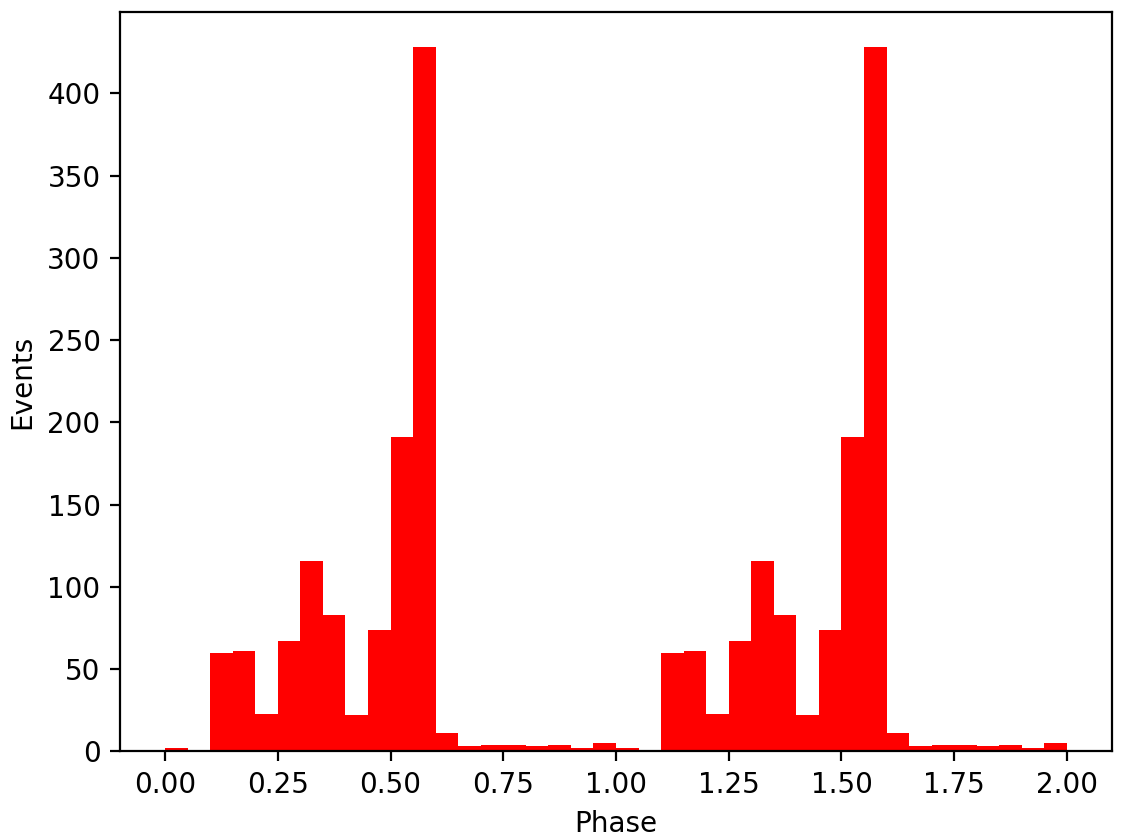
The selected events as a function of phase are displayed below. The background is considerably reduced with respect to the simple radius cut that was used before, and the pulsations of the Vela pulsar are now clearly visible.
Phase histogram of events for events having a probability of >10% in originating from the Vela pulsar
Since every event in the event files of the Data Challenge is tagged with a
Monte Carlo identifier that specifies from which model component it was
simulated, you may check how many events from the Vela pulsar are actually
expected in the data. The correspondance between the model components and
the Monte Carlo identifiers is given in the header of the event files
(see Data organisation), and from there you will find out that
the Vela pulsar has the Monte Carlo identifier 91. You can then select only
the events with this identifier by adding the attribute expr="MC_ID==91"
after the ctselect command:
$ ctselect expr="MC_ID==91" usepnt=no forcesel=yes
Input event list or observation definition XML file [obs_vela_phased_prob.xml] obs_vela_phased.xml
RA for ROI centre (degrees) (0-360) [128.838]
Dec for ROI centre (degrees) (-90-90) [-45.178]
Radius of ROI around pointing or specified RA/DEC (degrees) (0-180) [5.0]
Start time (UTC string, JD, MJD or MET in seconds) [NONE]
Lower energy limit (TeV) [0.03]
Upper energy limit (TeV) [160.0]
Output event list or observation definition XML file [obs_vela_phased_prob_selected.xml] obs_vela_phased_mcid.xml
The resulting phase histogram is shown below. It confirms that the peaks seen in the event histogram do indeed correspond to the expected peaks from the Vela pulsar. Note that the peak has an amplitude of about 440 events, while the peak above background in the figures above is about 250 events, indicating that almost half of the events were surpressed by the radius or probability cuts.
Distribution of Vela pulsar events as function of event phase
Note
The plots were created using the show_phases.py script that is
located in the ctools example folder. The example script requires the
matplotlib Python module for display.
You may reproduce the plots by typing
$ $CTOOLS/share/examples/python/show_phases.py obs_vela_phased_selected.xml
$ $CTOOLS/share/examples/python/show_phases.py obs_vela_phased_prob_selected.xml
$ $CTOOLS/share/examples/python/show_phases.py obs_vela_phased_mcid.xml