Generating a TS map
What you will learn
You will learn how you can generate a Test Statistic map for COMPTEL data.
Eventually you may want to investigate if gamma-ray sources are present
in a specific data set. You do this using the comlixmap script that
generates a maximum likelihood map, also known as Test Statistic map. In the
example below, a Test Statistic map with 10x10 pixels is generated around
the position of the Crab pulsar and pulsar wind nebula. Note that comlixmap
will fit a test source jointly for the four energy bins that are present in
the
observation definition file obs_binned.xml.
$ comlixmap
Input observation definition file [obs.xml] obs_binned.xml
Input model definition file [models.xml]
Test source name [Crab]
Coordinate system (CEL - celestial, GAL - galactic) (CEL|GAL) [GAL]
Projection method (AIT|AZP|CAR|GLS|MER|MOL|SFL|SIN|STG|TAN) [TAN]
First coordinate of image center in degrees (RA or galactic l) (0-360) [180.24] 184.6
Second coordinate of image center in degrees (DEC or galactic b) (-90-90) [-1.50] -5.8
Image scale (in degrees/pixel) (0.01-10.0) [1.0]
Size of the X axis in pixels (1-500) [10]
Size of the Y axis in pixels (1-500) [10]
Method for background computation (PHINOR|BGDLIXA|BGDLIXE) [BGDLIXE]
Output Test Statistic map file [tsmap.fits]
Warning
The executing of the comlixmap script takes some time since an iterative SRCLIX analysis is performed at each of the map’s grid positions. The example above takes between 30 min and 2 hours, depending on operating system and processor speed.
On output comlixmap creates a Test Statistic map, which in the example
above is named tsmap.fits. The figure below shows the content of the map,
which reveals a significant gamma-ray source at the position of the Crab.
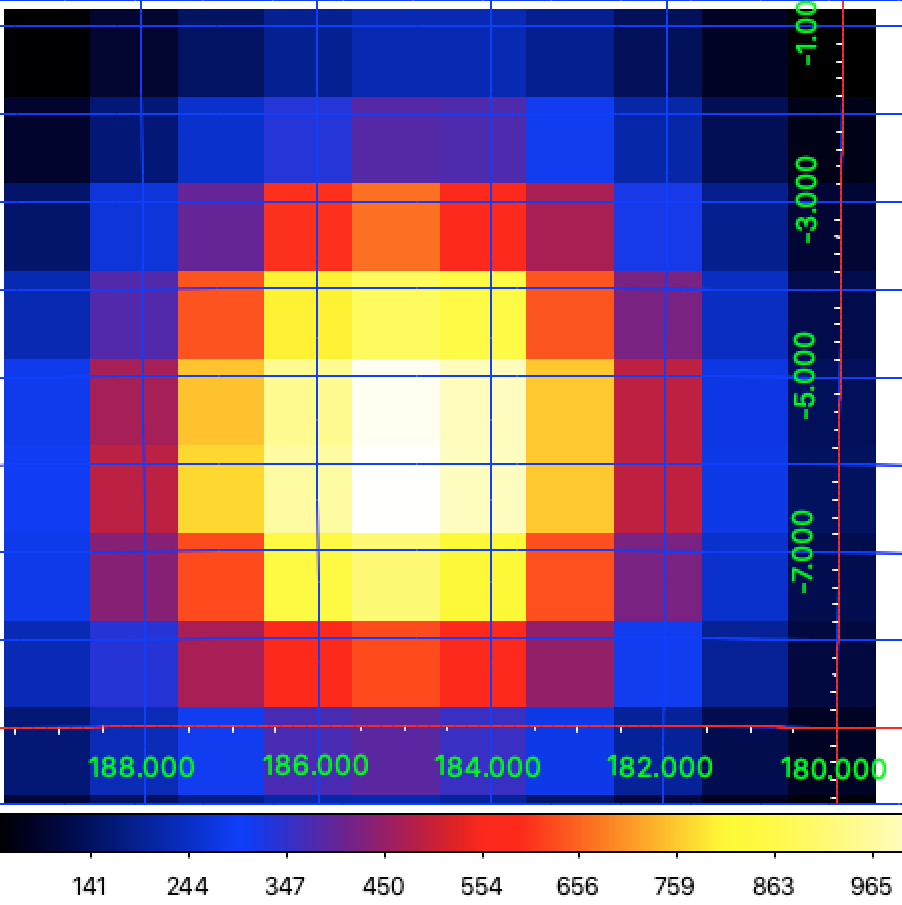
Test statistic map around the Crab for viewing period 0001