Using valgrind
Mac OS X
A valgrind analysis is performed using the valgrind tool. Here we
show as example how the createfits executable in the C++ example folder
is profiled. Please create a profiling directory in the GammaLib source
tree, step into that directory and type:
$ mkdir profiling
$ cd profiling
$ valgrind --tool=callgrind -v --dump-every-bb=10000000 ../examples/cpp/.libs/createfits
Warning
You should run the valgrind tool in a dedicated repository since a large
number of output files will be generated.
Note
To profile a C++ class you need to create a binary executable. Please make sure that you profile the binary executable and not a script that is eventually generated and wrapped around the binary executable.
The valgrind tool will generate a number of ASCII output files with names
callgrind.out.XXXX where XXXX is a number. You can display the results
contained in these files using the qcachegrind tool:
$ qcachegrind
The figure below shows the result obtained when running the createfits
executable.
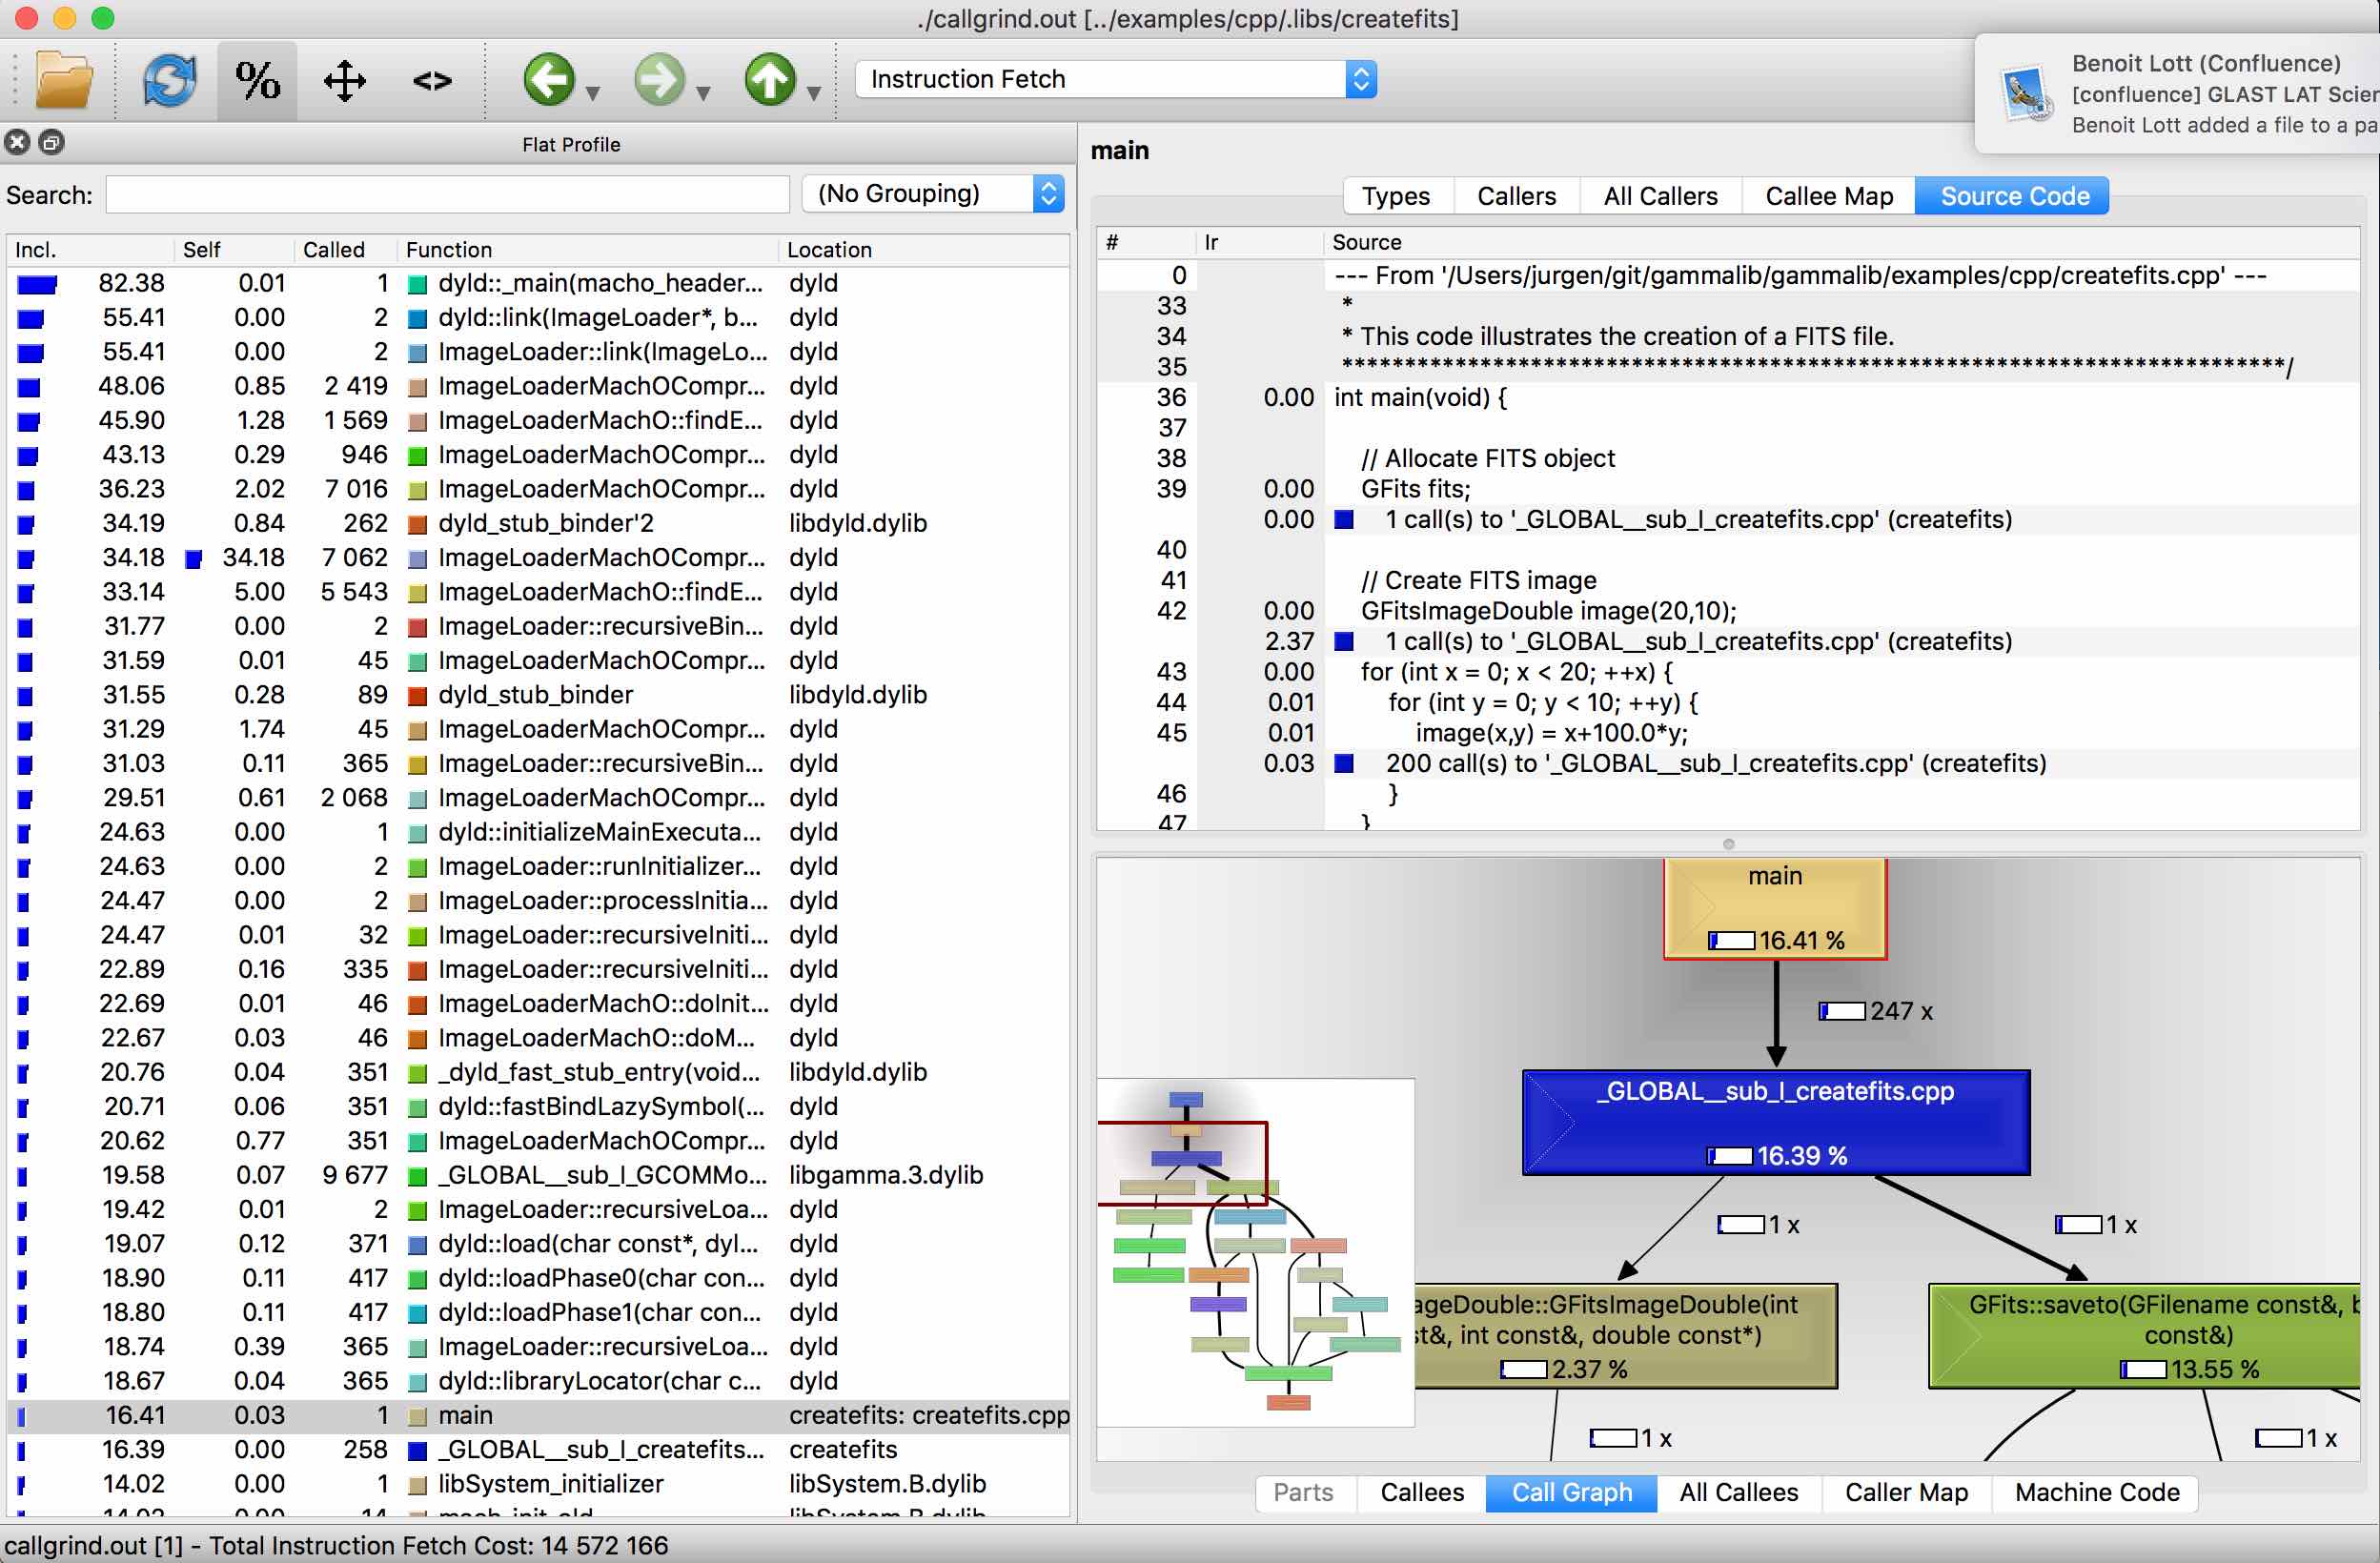
qcachegrind window