As next analysis step you will bin the data into a counts cube using ctbin. A counts cube is a 3-dimensional data cube, spanned by Right Ascension (or Galactic longitude), Declination (or Galactic latitude), and energy (by default logarithmically spaced, but this is under your control).
ctbin is executed by typing:
$ ctbin
Input event list or observation definition XML file [events.fits]
First coordinate of image center in degrees (RA or galactic l) (0-360) [83.63]
Second coordinate of image center in degrees (DEC or galactic b) (-90-90) [22.01]
Projection method (AIT|AZP|CAR|MER|MOL|STG|TAN) [CAR]
Coordinate system (CEL - celestial, GAL - galactic) (CEL|GAL) [CEL]
Image scale (in degrees/pixel) [0.02]
Size of the X axis in pixels [200]
Size of the Y axis in pixels [200]
Algorithm for defining energy bins (FILE|LIN|LOG) [LOG]
Start value for first energy bin in TeV [0.1]
Stop value for last energy bin in TeV [100.0]
Number of energy bins [20]
Output counts cube file [cntcube.fits]
In this example the events from file events.fits will be binned into a counts cube stored into the file cntcube.fits. The counts cube is centred on the location of the Crab nebula (Right Ascension 83.63°, Declination 22.01°). A cartesian projection aligned in celestial coordinates is used and the counts cube has 200 x 200 spatial pixels of 0.02 x 0.02 degrees in size, covering an area of 4° x 4°, and 20 logarithmically spaced energy bins, covering an energy range from 0.1 TeV to 100 TeV.
The cntcube.fits file produced by ctbin contains four extensions:
The following image shows the cntcube.fits file produced in the example above. The EBOUNDS table has 20 rows, one for each energy bin, while the GTI table has just a single row, indicating the start and stop time of the simulated data.
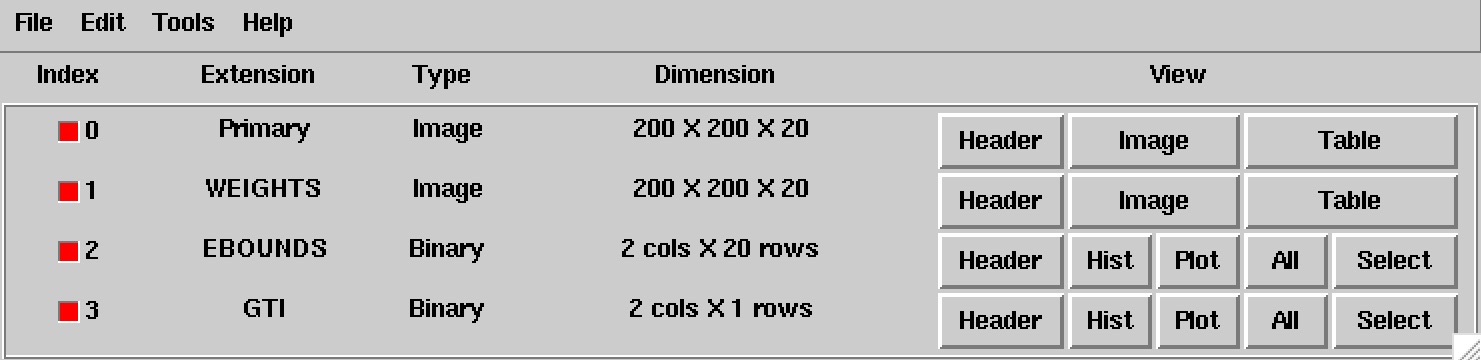
Extensions of a counts cube FITS file
An image of the first bin, covering the energy range 100 - 141 GeV, is shown below:
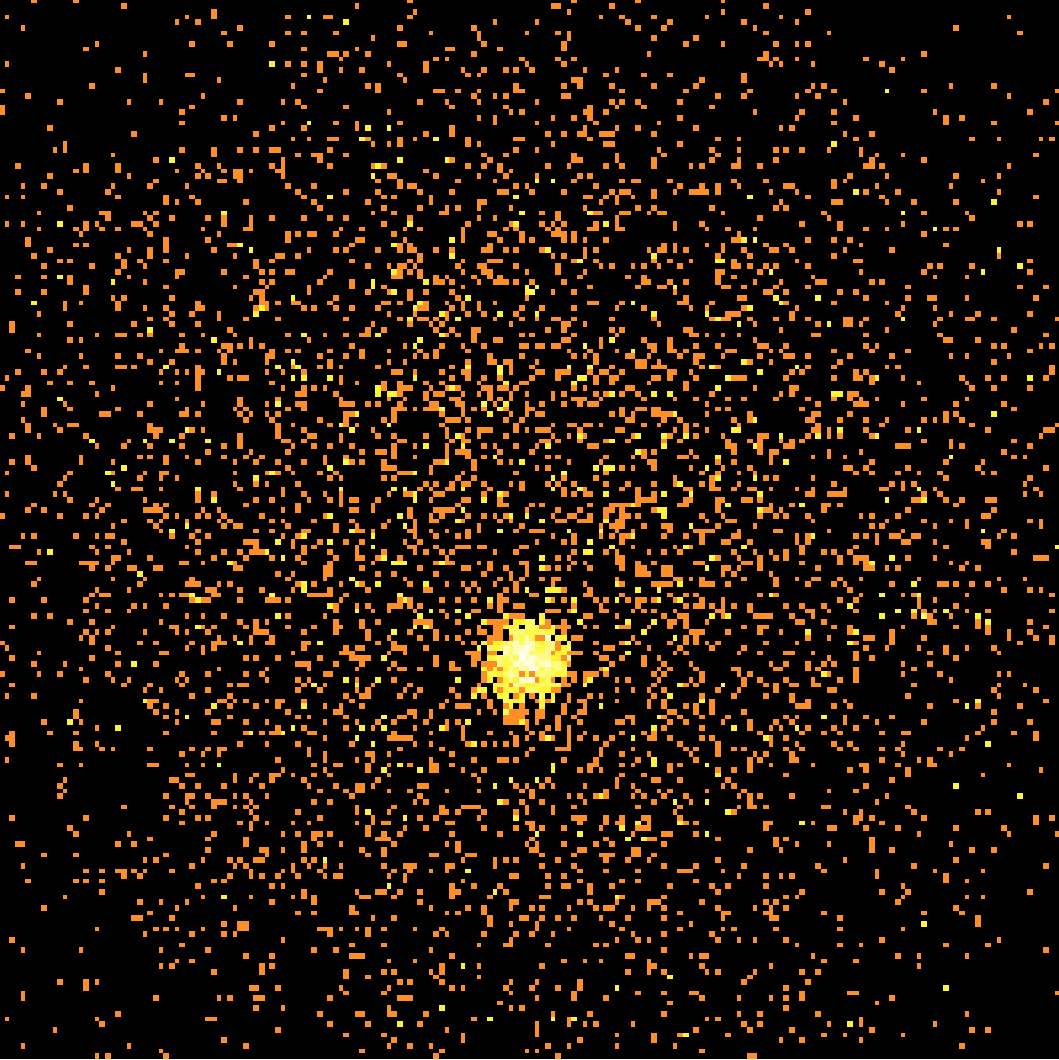
Image of first energy bin of a counts cube
For illustration, the last few lines of the log file ctbin.log are reproduced below:
2016-06-29T10:33:23: +=================+
2016-06-29T10:33:23: | Bin observation |
2016-06-29T10:33:23: +=================+
2016-06-29T10:33:23: === CTA observation ===
2016-06-29T10:33:23:  Events in list ............: 23099
2016-06-29T10:33:23:  Events in cube ............: 18532
2016-06-29T10:33:23:  Event bins outside RoI ....: 0
2016-06-29T10:33:23:  Events outside cube area ..: 4567
2016-06-29T10:33:23:  Events outside energy bins : 0
From the 23099 events that have been simulated and stored in the events.fits file, 18532 lie within the cube boundaries and are thus put into the resulting counts cube.