How to generate a light curve?
What you will learn
You will learn how to generate a light curve for a source to study the temporal variation of the flux and spectrum.
You can generate a light curve using the cslightcrv script which takes on input an event list or an observation definition file. Light curves cannot be generated from counts cubes since the time information is dropped in the generation of the counts cube.
cslightcrv divides the event list into a number of intervals and performs a maximum likelihood analyse for each of the intervals. The analysis results are writted into a light curve FITS file.
The following example illustrates how you can generate a light curve for
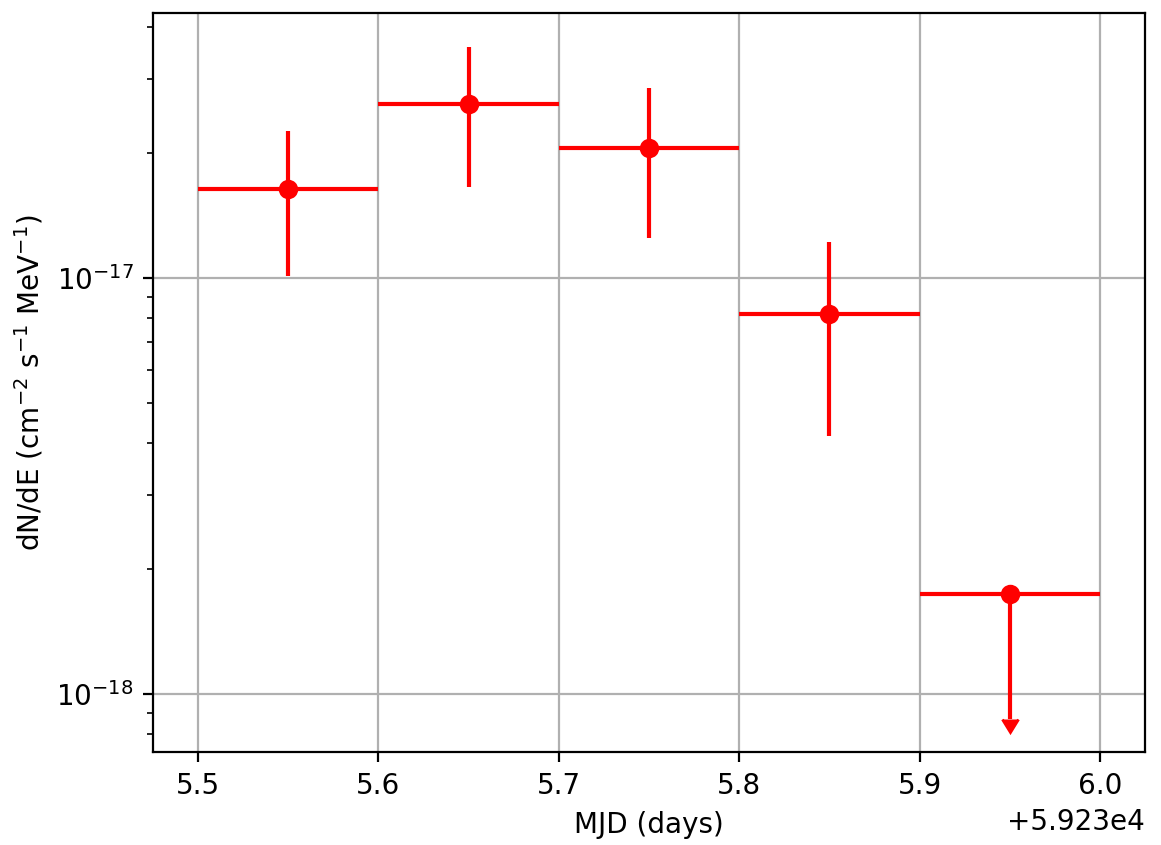
Src002 for the time interval from 59235.5 to 59236.0 (MJD),
corresponding to the dates from 2021-01-21 (12:00:00) to 2021-01-22 (00:00:00)
(to convert dates to MJD and vice versa we suggest to use the
xTime Date and Time Conversion Utility).
The time interval is linearly divided into 5 time bins.
$ cslightcrv
Input event list or observation definition XML file [events.fits] obs_selected.xml
Input model definition XML file [$CTOOLS/share/models/crab.xml] $CTOOLS/share/models/1dc_howto_unbinned.xml
Algorithm for defining time bins (FILE|LIN|GTI) [GTI] LIN
Lightcurve start time (UTC string, JD, MJD or MET in seconds) [MJD 51544.5] MJD 59235.5
Lightcurve stop time (UTC string, JD, MJD or MET in seconds) [MJD 51544.6] MJD 59236.0
Number of time bins (1-10000) [5]
Analysis method (3D|ONOFF) [3D]
Source name [Crab] Src002
Lower energy limit of events (TeV) [0.1]
Upper energy limit of events (TeV) [100.0]
Number of energy bins for binned (0=unbinned for 3D analysis only) (0-100) [0]
Output light curve file [lightcurve.fits]
The resulting light curve is shown in the figure below.

Light curve from 59235.5 to 59236.0 (MJD) for Src002
Note
The plot was created using the show_lightcurve.py script that is
located in the ctools example folder. The example script requires the
matplotlib Python module for display.
You may reproduce the plot by typing
$ $CTOOLS/share/examples/python/show_lightcurve.py lightcurve.fits