How to display the results?
What you will learn
You will learn how to display results using some example scripts written in Python.
Please not that these scripts need the
matplotlibPython module installed.
The ctools package does not contain any tools or scripts for graphical display of results since results are generally written into standard FITS files that are readily displayed by existing astronomical tools.
Nevertheless, for your convenience several scripts for graphical display are
included in the ctools package that rely on the
matplotlib
Python module. You can find these scripts in the
$CTOOLS/share/examples/python folder. The following scripts are available:
Script
Usage
show_butterfly.pyDisplay butterfly diagram
show_irf.pyDisplay Instrument Response Function
show_lightcurve.pyDisplay light curve
show_obs.pyDisplay observation summary
show_pha.pyDisplay Pulse High Analyser File
show_phases.pyDisplay event phases
show_pointings.pyDisplay pointing directions
show_residuals.pyDisplay spectral residuals
show_response.pyDisplay response components
show_rmf.pyDisplay Redistribution Matrix File
show_significance_distribution.pyDisplay significance distribution
show_spectrum.pyDisplay spectrum
Do not hesitate to copy and adapt these scripts to your needs.
Below some usage examples and the expected output.
show_butterfly.py
$ $CTOOLS/share/examples/python/show_butterfly.py butterfly.txt
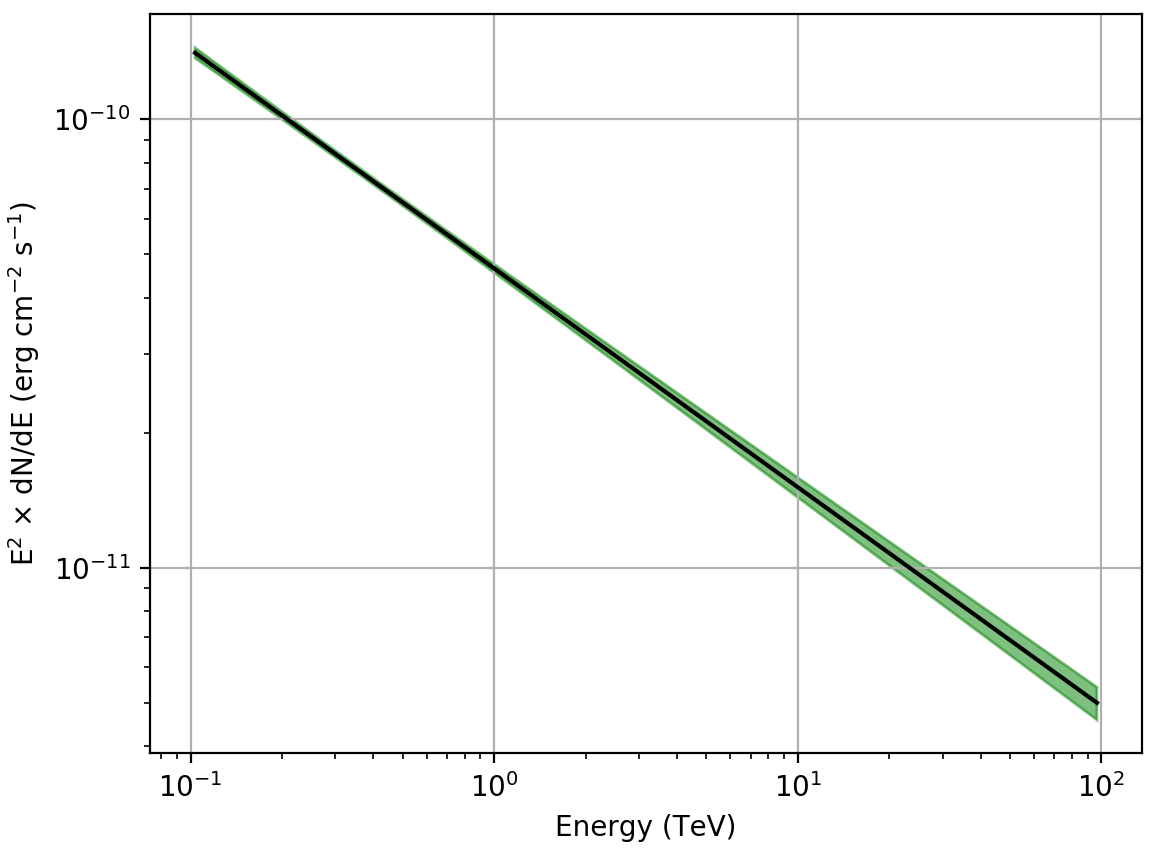
Butterfly diagram displayed with show_butterfly.py
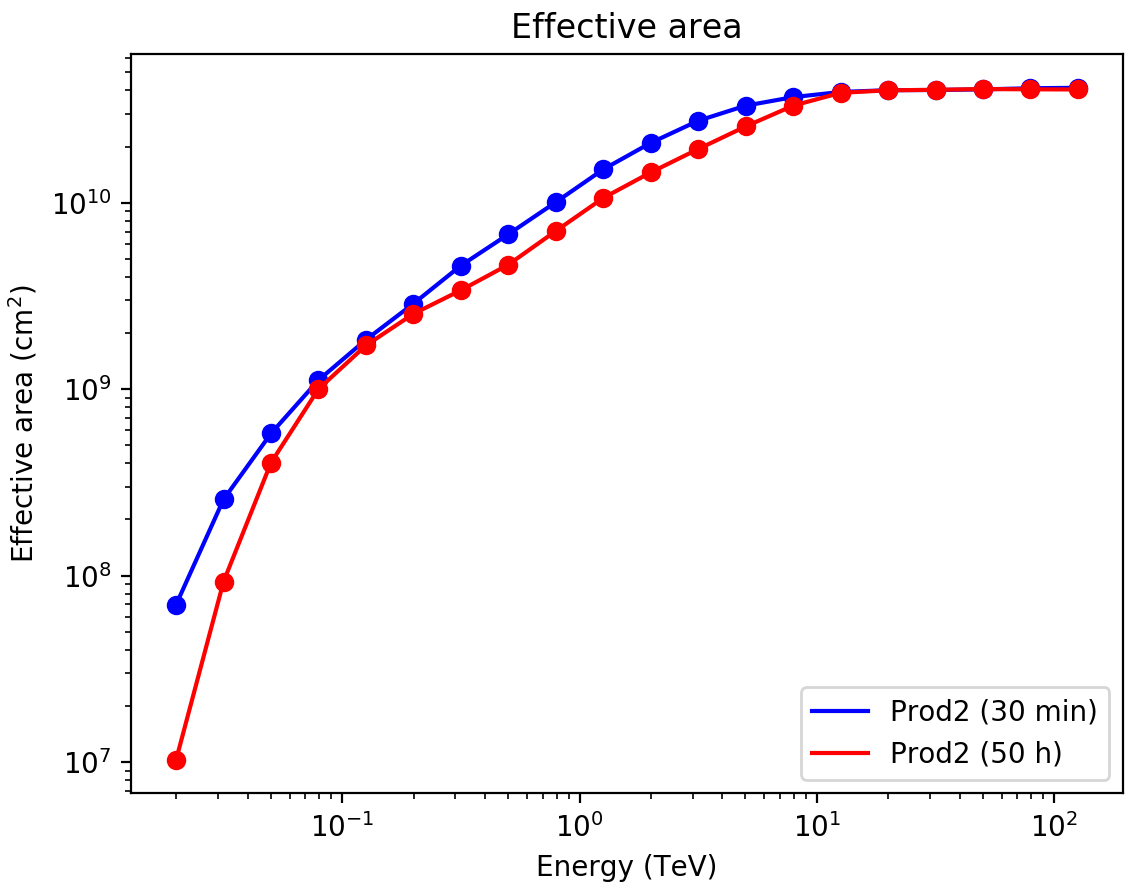
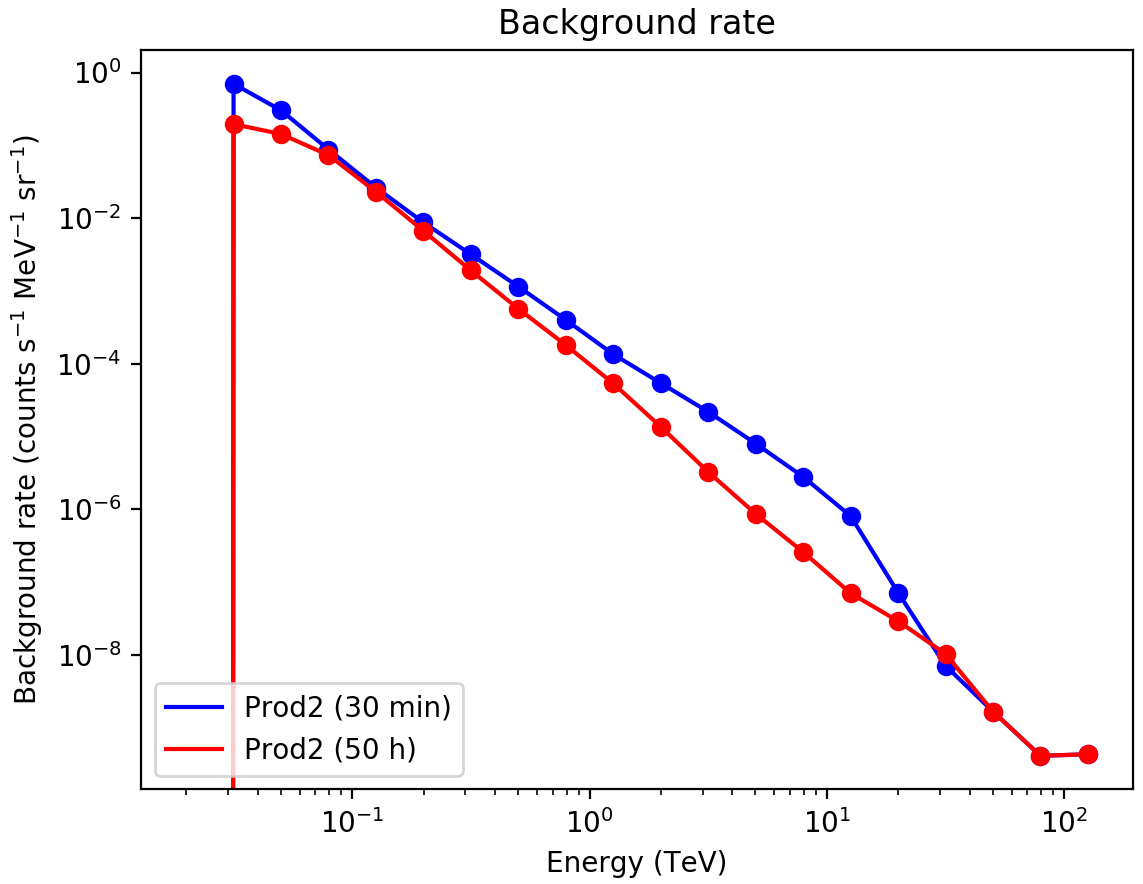
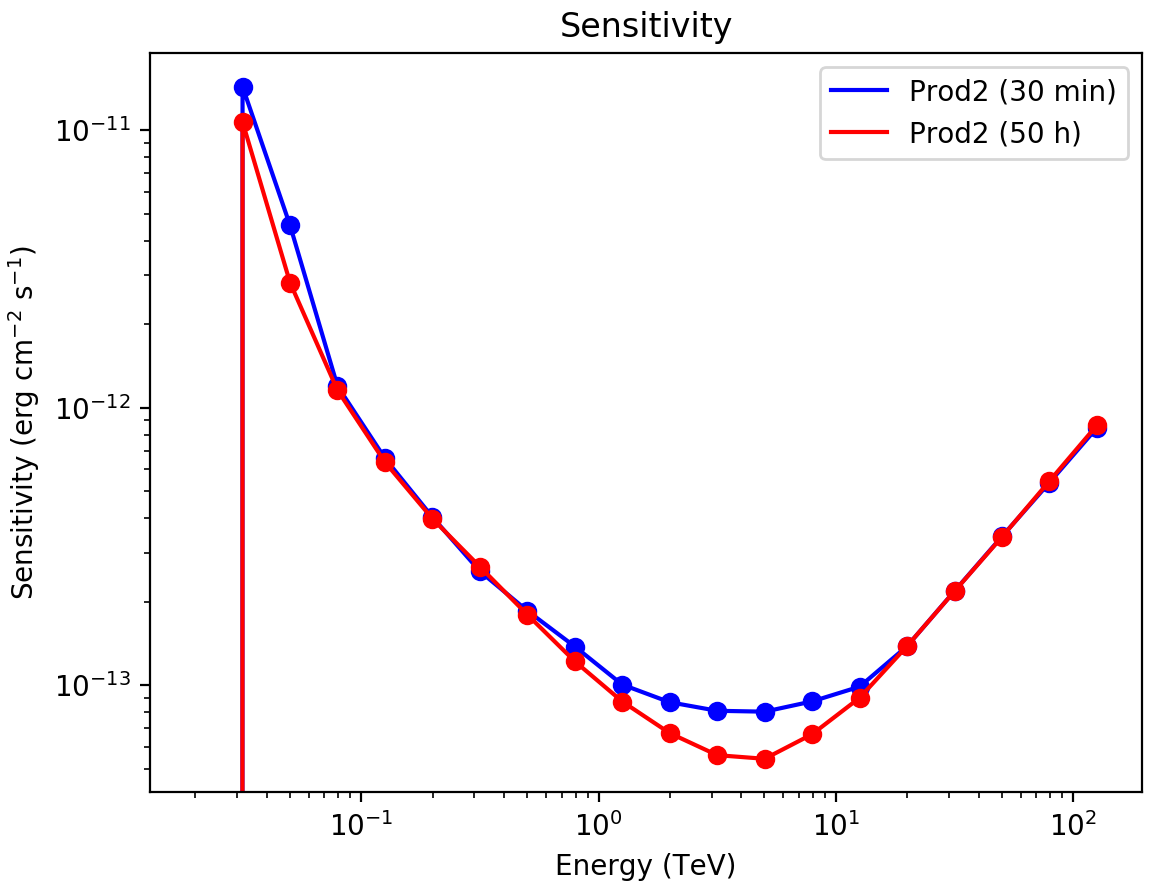
show_irf.py
$ $CTOOLS/share/examples/python/show_irf.py prod2 South_50h

Instrument Response Function displayed with show_irf.py
show_lightcurve.py
$ $CTOOLS/share/examples/python/show_lightcurve.py lightcurve.fits
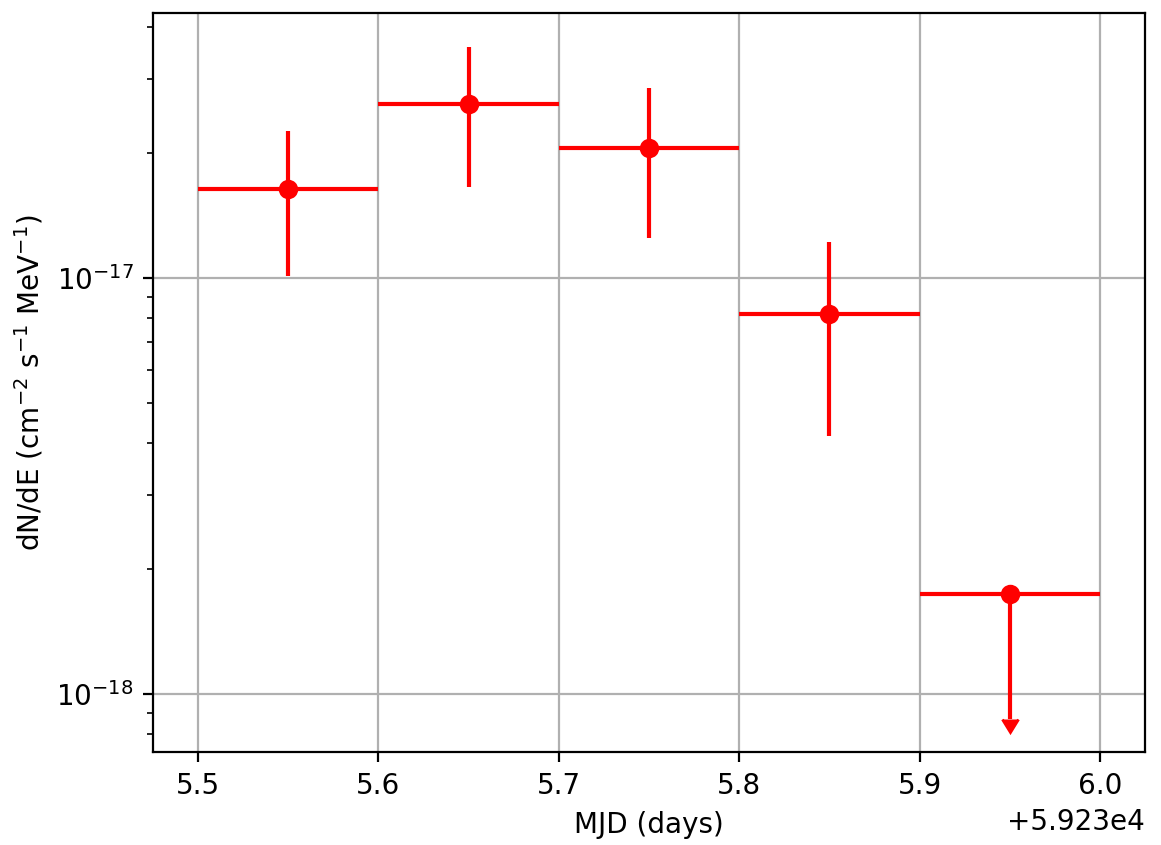
Light curve displayed with show_lightcurve.py
show_obs.py
$ $CTOOLS/share/examples/python/show_obs.py obs.xml

Observation summary displayed with show_obs.py
show_pha.py
$ $CTOOLS/share/examples/python/show_pha.py pha.fits
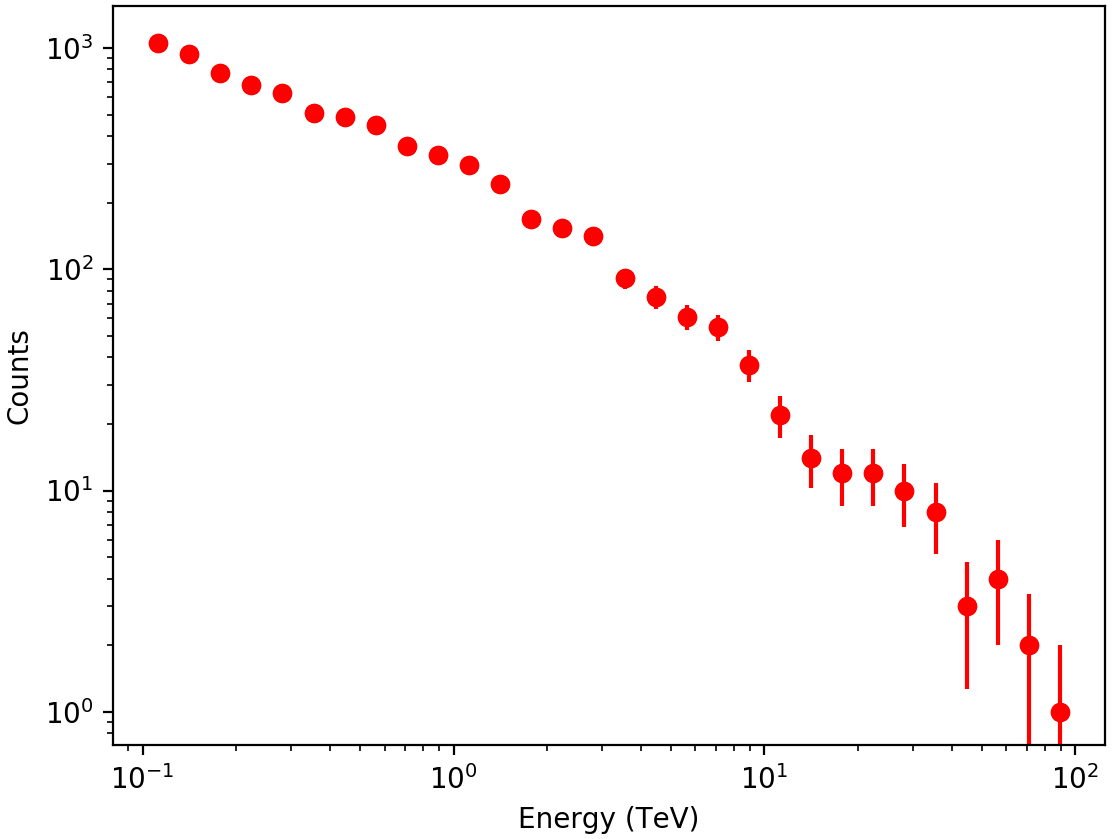
Pulse Hight Analyser File displayed with show_pha.py
show_phases.py
$ $CTOOLS/share/examples/python/show_phases.py -n 50 events_phased.fits

Event phases displayed with show_phases.py
show_pointings.py
$ $CTOOLS/share/examples/python/show_pointings.py obs.xml
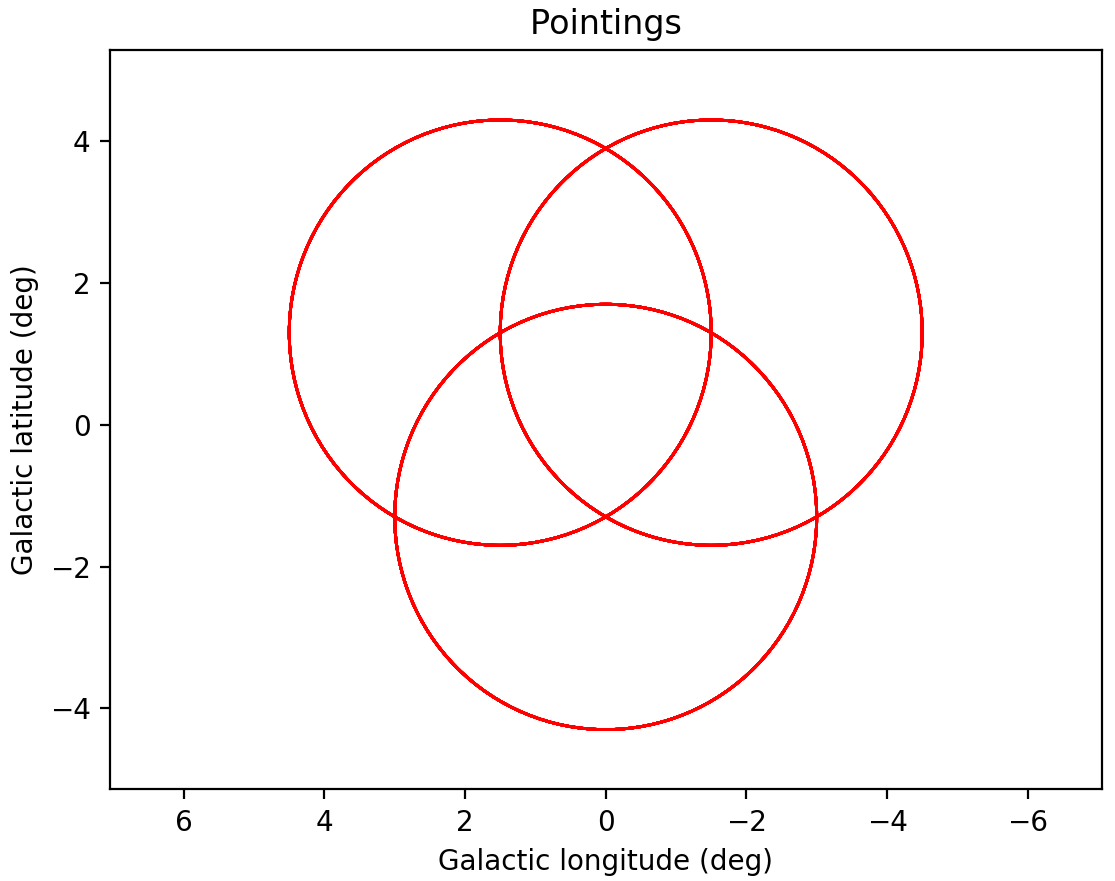
Pointings displayed with show_pointings.py (zoomed in)
show_residuals.py
$ $CTOOLS/share/examples/python/show_residuals.py residual.fits
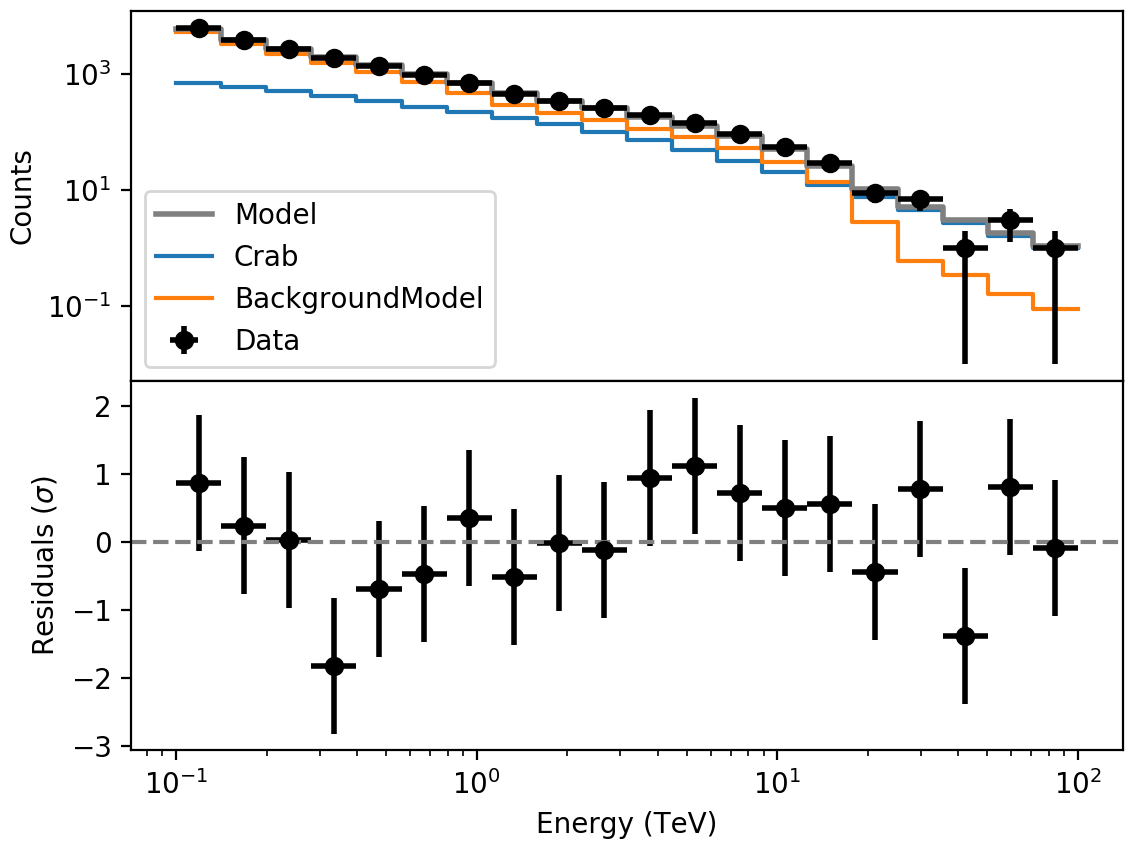
Spectral residuals displayed with show_residuals.py
show_response.py
$ $CTOOLS/share/examples/python/show_response.py
show_rmf.py
$ $CTOOLS/share/examples/python/show_rmf.py rmf.fits

Redistribution Matrix File displayed with show_rmf.py
show_significance_distribution.py
$ $CTOOLS/share/examples/python/show_significance_distribution.py skymap.fits --exclude skymap.fits[EXCLUSION]
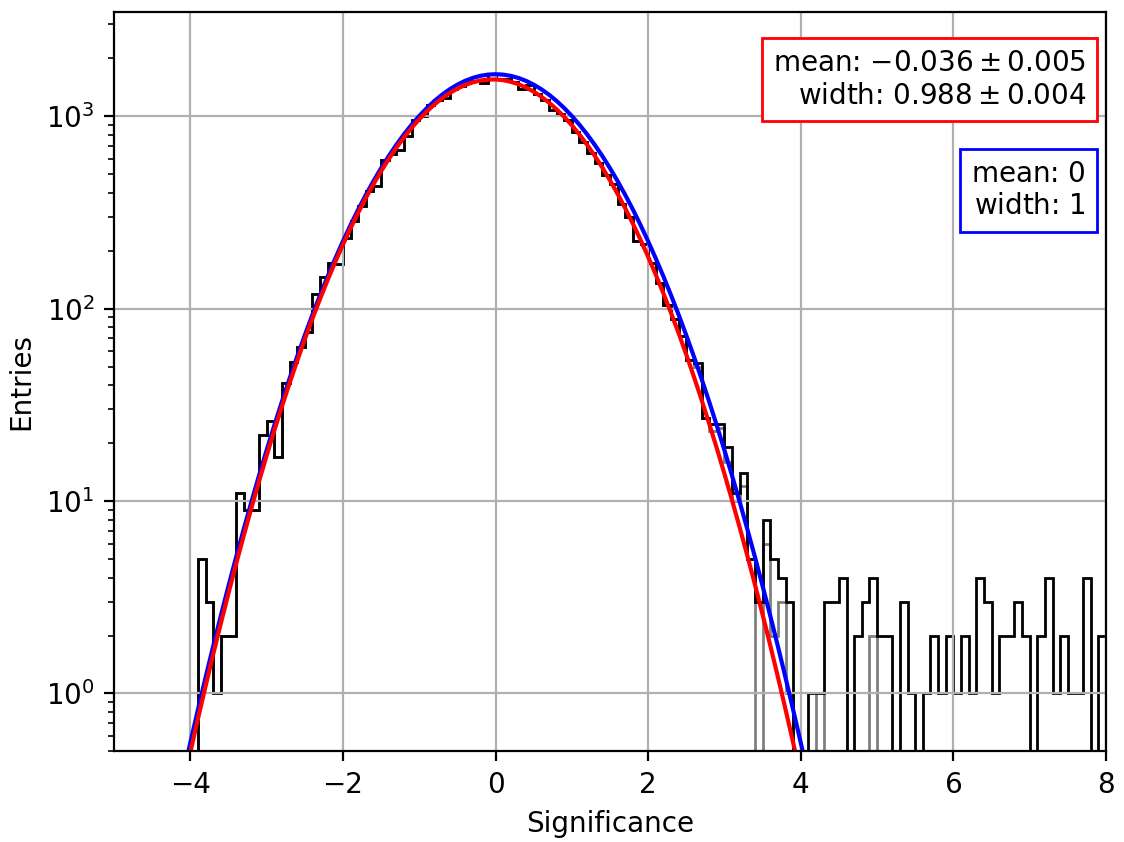
Significance distribution displayed with show_significance_distribution.py
show_spectrum.py
$ $CTOOLS/share/examples/python/show_spectrum.py spectrum.fits
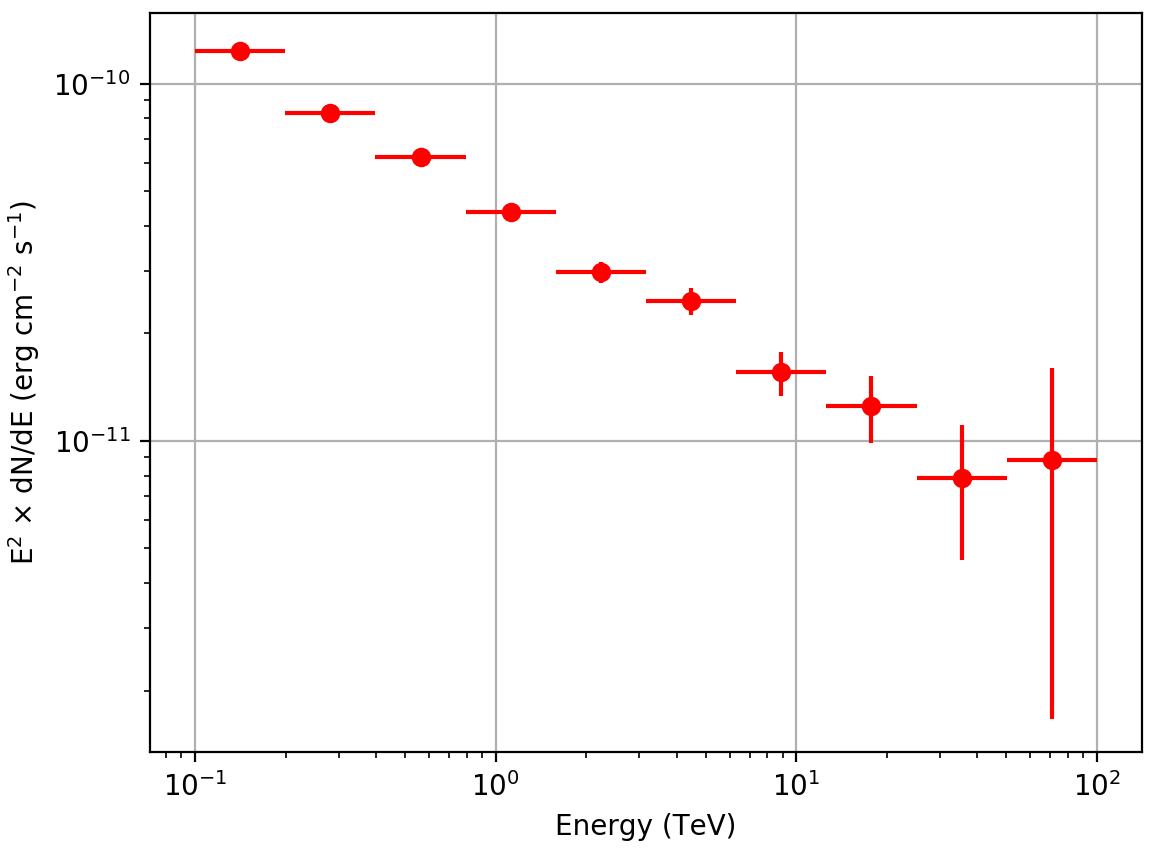
Spectrum displayed with show_spectrum.py